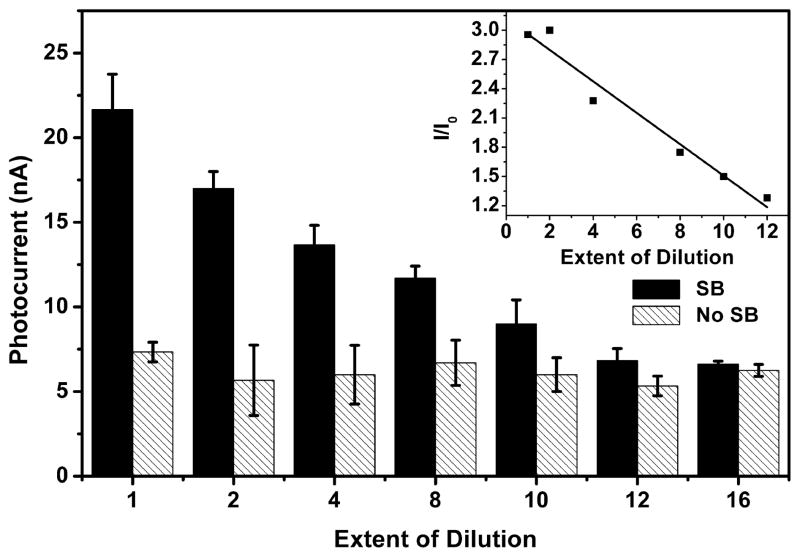
Figure 3.
Photocurrent intensity of Ru–streptavidin labeled Duplex 2 films with different extent of dilution. Filled column: DNA films with biotinylation. Shaded column: DNA film without biotinylation. Inset is a plot of the relative photocurrent intensity as a function of the extent of dilution. Error bars represent the standard deviation of three replicate electrodes.

