Figure 3.
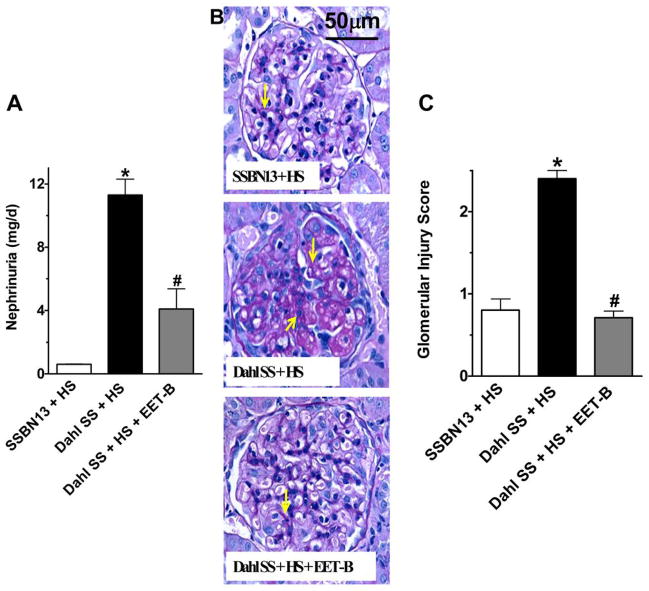
Fig 3A–C. (A) Urinary excretion of nephrin, (B) representative photomicrographs of Periodic Acid-Schiff (PAS) staining (200x) depicting glomerular injury with mesangial expansion (yellow arrows) and other changes related to glomerular sclerosis in different experimental groups. (C) Semi-quantitative scoring of glomerular injury in rats from different experimental groups. *p<0.05 vs. SSBN13 rats treated with vehicle; #p<0.05 vs. vehicle treated Dahl SS rats. Data expressed as mean ± SEM, n=6–7.

