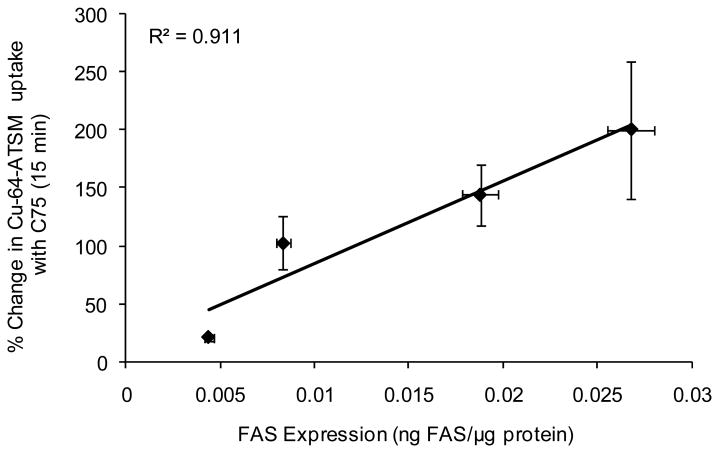
Figure 3.
Correlation of FAS expression as determined by ELISA to % change in 64Cu-ATSM uptake between C75 treated (100 μM) and control cells under anoxic conditions (5% CO2, 95% N2) at 15 min post-incubation. Points on the graph represent LAPC-4, PC-3, LNCaP, and 22Rv1 from left to right. (n = 3 at each timepoint)

