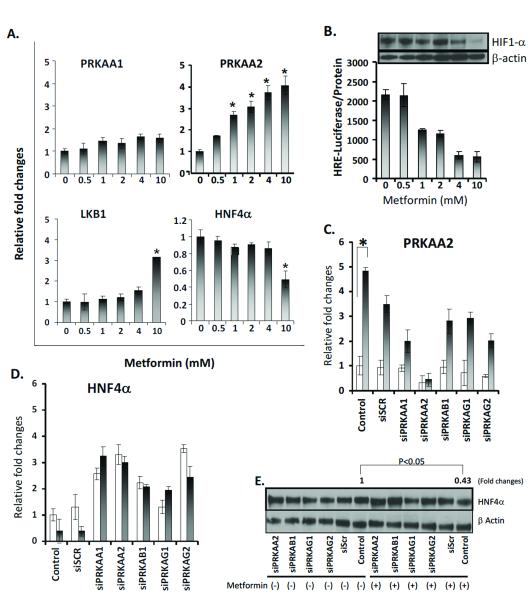
Figure 5. Analysis of metformin-activated AMPK function in gastric cancer cells.
NCI-N87 and NCI-N87-HRE cells were cultured for 18 h under hypoxic conditions (1% O2, 5% CO2, 94% N2). (A) NCI-N87 cells were treated in different concentrations of metformin. PRKAA2 expression was measured by RT-PCR and expressed relative to cells without metformin. Values are the means of three measurements. (B) NC-N87 cells transfected with HRE-luciferase treated at different concentrations of metformin. HRE-luciferase was used to measure the HRE response. Values are the means of three measurements. (Panel) Western blot of HIF-1α protein level in NCI-N87, treated at different metformin concentrations, β-actin as loading controls. (C, D) NCI-N87 cells transfected for 72 h with different siRNAs and treated without (open bars) or with 10 mM metformin (filled bars). PRKAA2 and HNF4α expression was measured by RT-PCR and expressed relative to cells treated without metformin (control). Values are the means of three measurements. *P < 0.05 compared to cells without metformin. (E) Western blot of HNF4α protein levels of cells transfected with different siRNAs, treated without or with 10 mM metformin.

