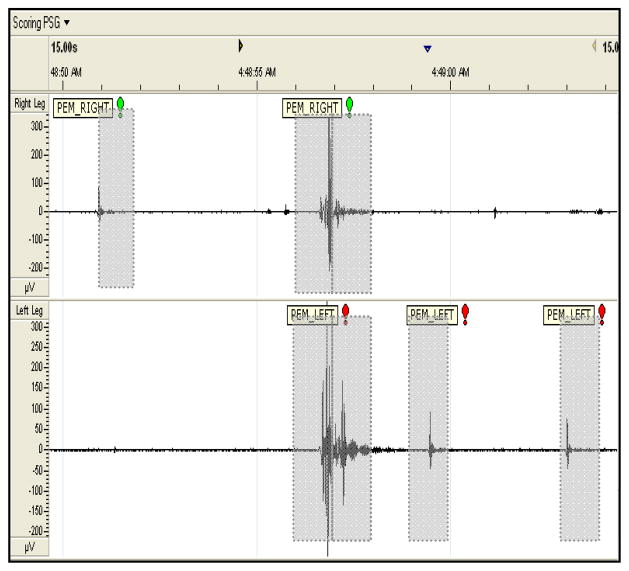
Fig. 1.
Plot of Scorer E labeling for a 15 second duration of EMG activity, from Table I, PEM_RIGHT indicates right leg PEM activity (top panel) and PEM_LEFT indicates left leg PEM activity (bottom panel). One second PEM labeling shown in dotted gray rectangles.

