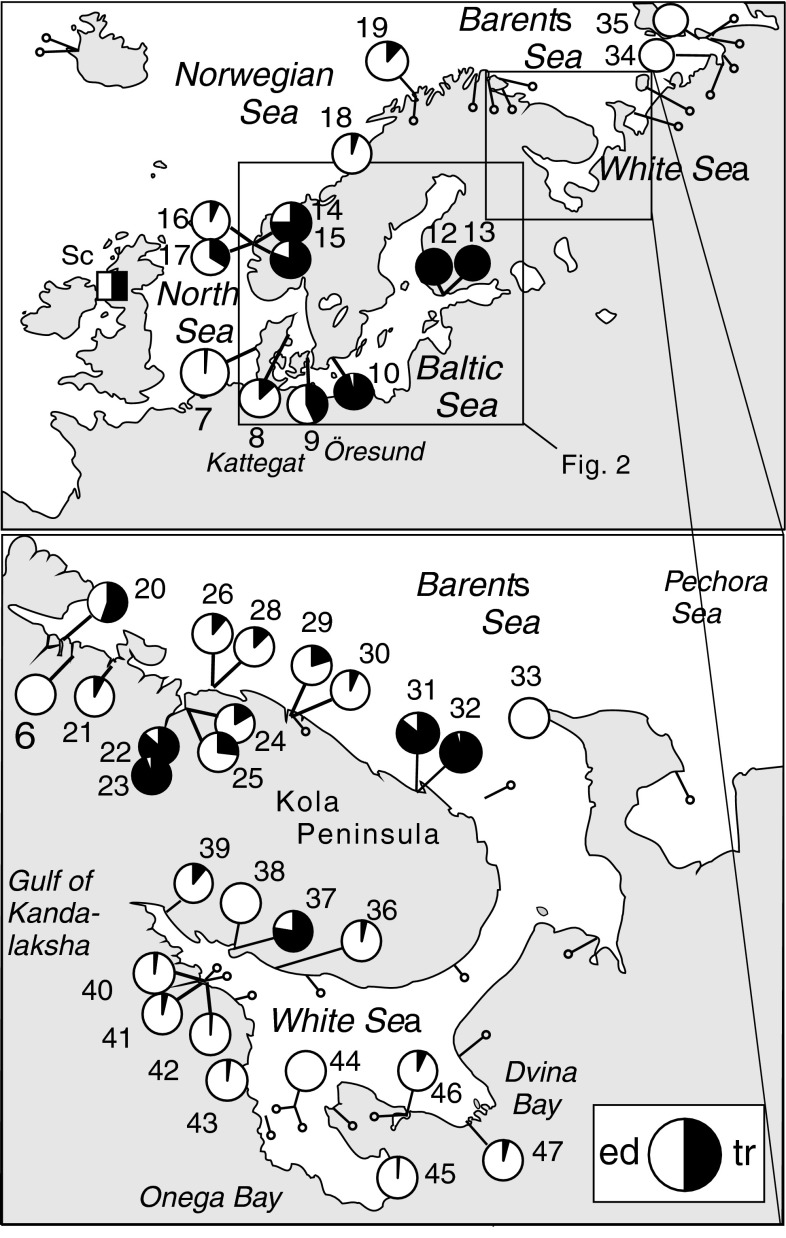
Fig. 1.
Distribution of the studied samples of the Main data set in Northern Europe. The pie charts indicate the samples studied with the 8-locus allozyme character set, with estimates of M. trossulus (black) versus M. edulis (white) genomic proportions as obtained from the PCA ordination in Fig. 3. The smaller symbols (pins) indicate samples from literature data, from where M. edulis only was previously recorded on genetic grounds (Varvio et al. 1988; McDonald et al. 1991; Hummel et al. 1999, 2001). “Sc” (square symbol) indicates published observations of M. trossulus from a Scottish loch, within the M. edulis/M. galloprovincialis range (Beaumont et al. 2008)

