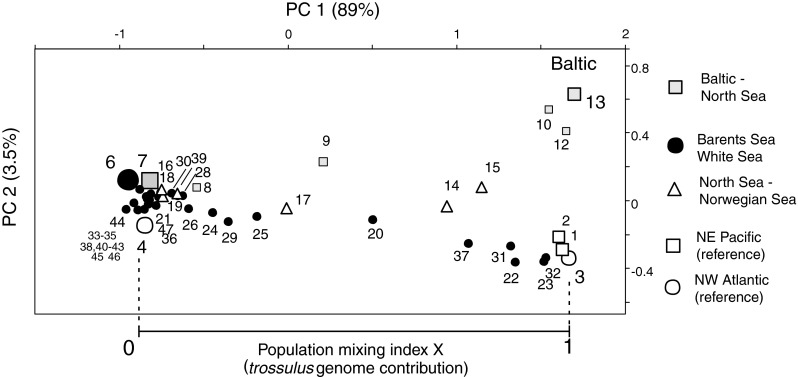
Fig. 3.

PCA ordination of the samples based on multilocus allele frequency data from 8 allozyme loci in the Main data set (Table 1, Electronic supplement 1). The plot shows the distribution of the new North European material between reference samples of pure European M. edulis (represented by samples #6 and #7) and North American M. trossulus (#3; St Andrews, New Brunswick). The relative placement of each sample on the PC1 axis between these points [0, 1] is taken as an estimate of the M. trossulus genomic contribution at the population level (population mixing index X; cf. Strelkov et al. 2007). Different symbols indicate different geographical regions, as indicated on the right. The axes are drawn to be proportional to the square root of the explained allele frequency variance in the analysis
