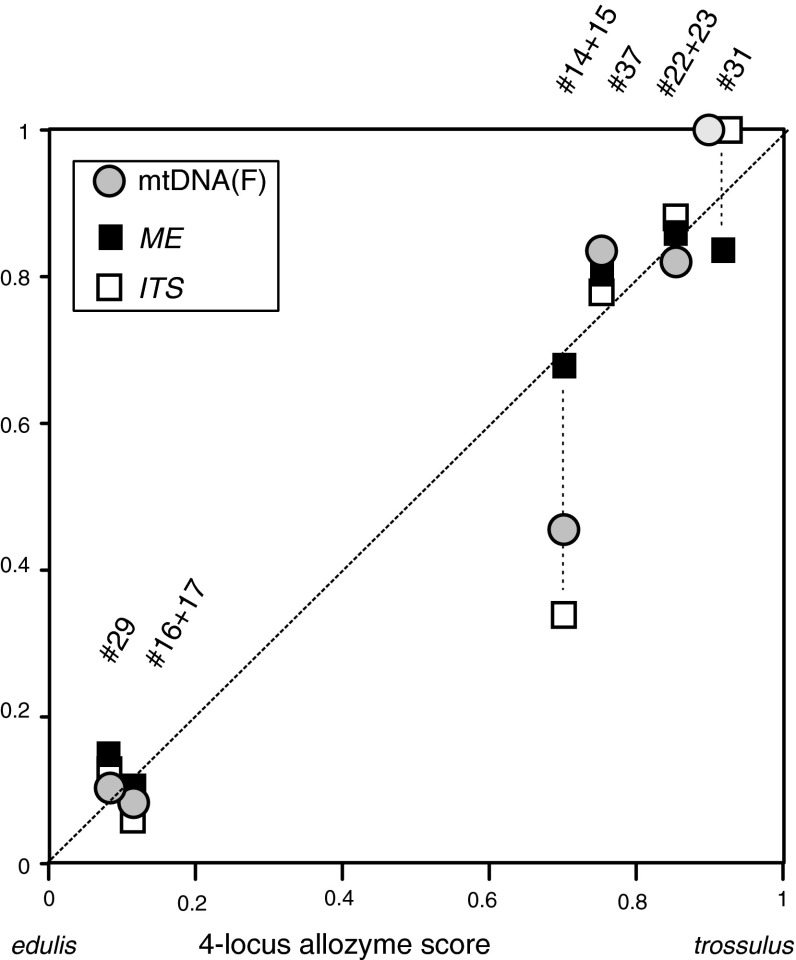
Fig. 6.
Correspondence of allelic compositions in allozyme versus DNA-based genetic markers in a set of selected regional samples of mixed ancestry. Frequencies of M. trossulus-specific alleles of three different DNA-based markers (Y-axis) are plotted against the scaled M. trossulus score from four nearly diagnostic allozyme loci (calculated from the same individuals, as in Fig. 4). Sample codes refer to Table 1 and Fig. 1, with sample sizes as follows. #14 + 15 Bergen city (N = 37), #16 + 17 Bergen Espeland (N = 22), #22 + 23 inner Kola Bay (N = 35), #29 Yarnishnaya, Murman coast (N = 18), #31 Gremikha, Murman coast (N = 10), #37 Umba, White Sea (N = 25)

