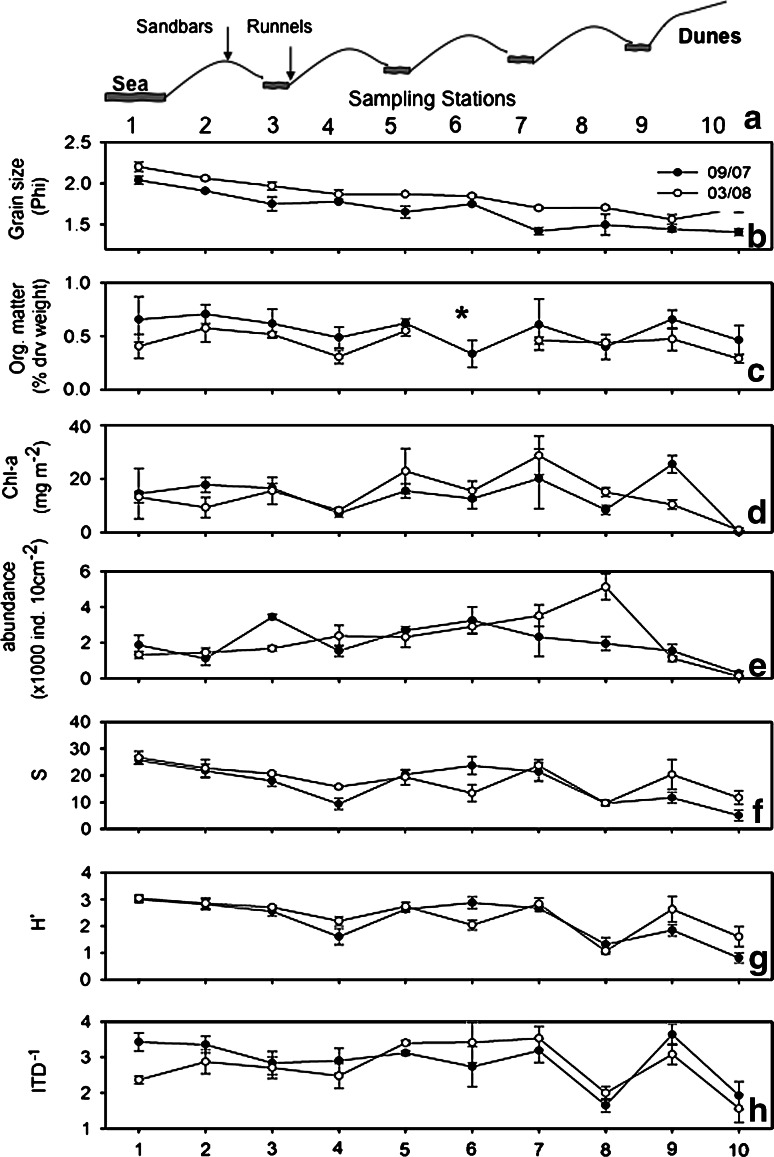
Fig. 2.
Environmental and biological variables across the intertidal in September 2007 (black circles) and March 2008 (open circles). a Schematic illustration of stations along a transect; means and standard deviations of b mean grain size (in Φ); c organic matter content (% dry weight); d chlorophyll a density (mgm−2); e nematode abundances (individuals 10 cm−2); f genus richness (S); g taxonomic diversity (Shannon Wiener H′) and h trophic diversity (ITD−1). Asterisks denote missing data

