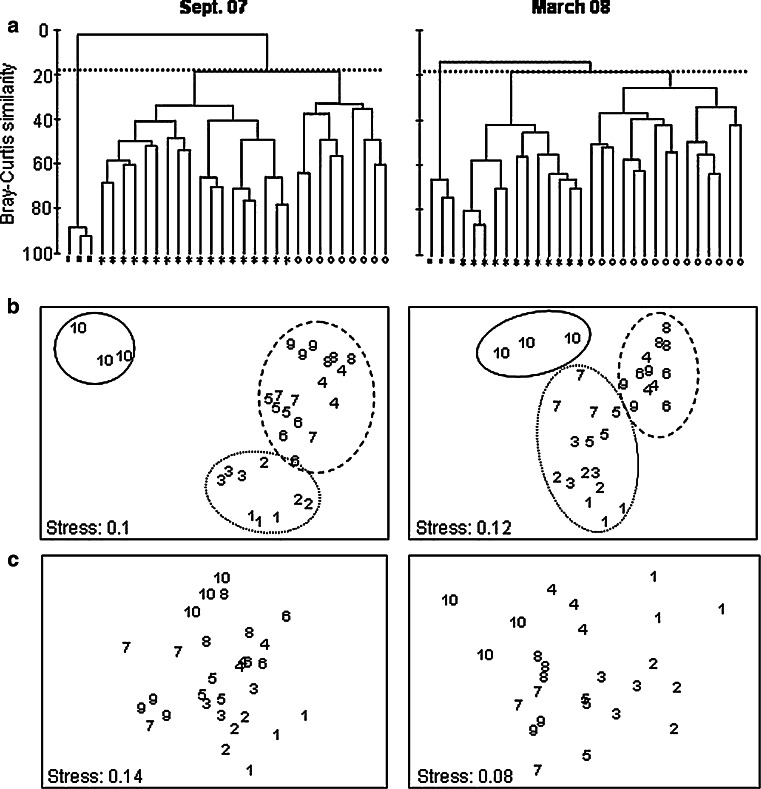
Fig. 3.
Multivariate analyses of community structure. a Cluster analyses based on Bray-Curtis similarities resulting in three main groups at 18.26% similarity in September 2007 and 18.25% in March 2008, indicated by the dotted lines. Symbols represent intertidal regions: open circles lower beach (September 2007 stations 1–3; March 2008 stations 1–3, 5, 7), asterisks middle beach (September 2007 stations 4–9; March 08 stations 4, 6, 8, 9), black squares upper beach (station 10). b Non-metric multidimensional scaling (MDS) of genus abundance for both sampling seasons. Replicate samples are identified by their station number. Lines reflect the same three main groups that resulted from the cluster analyses: continuous line station 10, dashed line stations 4–9 in September 2007 and stations 4, 6, 8, 9 in March 2008, dotted line stations 1–3 in September 2007 and stations 1–3, 5, 7 in March 2008. c Non-metric multidimensional scaling (MDS) of environmental variables (mean grain size, chlorophyll a and organic matter). Replicate samples are identified by their station number

