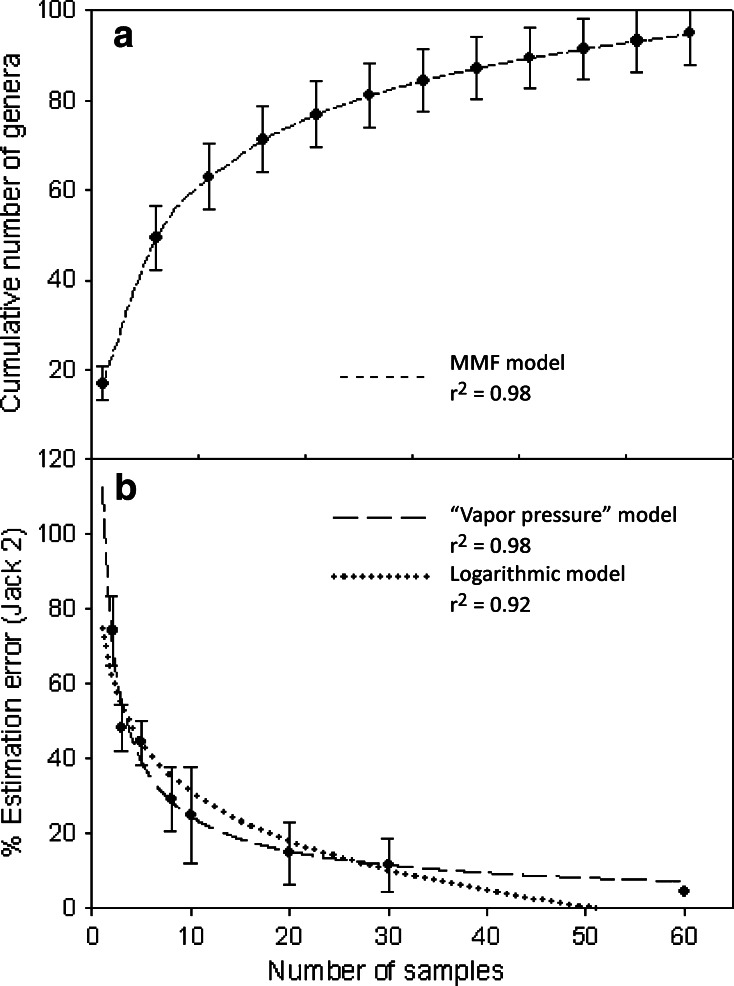
Fig. 4.
Local diversity and error estimations. a Species accumulation curve using the Ugland index for the combined datasets of September 2007 and March 2008 (black diamonds). The line indicates the adjusted MMF Model y = (ab + cx d)/(b + x d), where the model parameters are: a = −7.97, b = 4.36, c = 125.03 and d = 0.67. b Relative estimation error (mean and standard deviation) of the second-order jacknife richness estimator (Jack 2) for different samplesizes (black circles). Adjusted models: logarithmic model y = a + b ln(x) with the model parameters: a = 74.91, b = −18.99 (dotted line) and “vapor pressure model” y = ea + bx + c ln x with the model parameters: a = 4.78, b = −0.05 and c = −0.68 (dashed line). r 2 coefficient of determination

