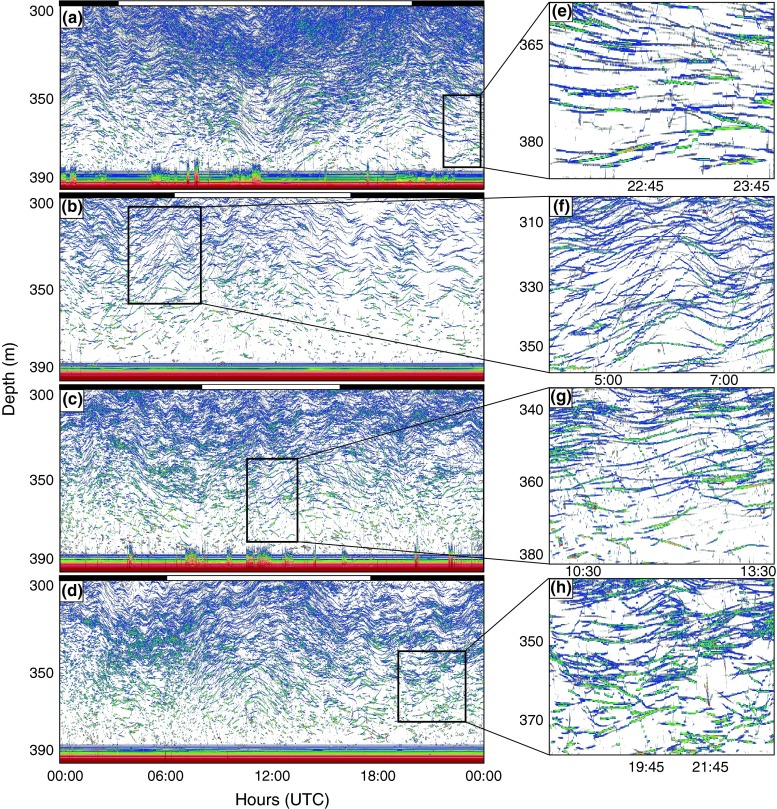
Fig. 5.
a–d 24-h Echograms from the bottom-mounted 38 kHz echo sounder on 8 August 2008 (a), 18 October 2007 (b), 2 February (c), and 12 March 2008 (d). The echograms are zoomed in at ~300–390 m. The outlined boxes are presented in higher resolution in (e–h). The color scale refers to average volume backscattering (S v); dark red illustrates the strongest, and white the weakest backscatter. Black and white bars above echograms depict night and day separated by times for sunrise and sunset. Time is given as UTC (local standard time −1 h)

