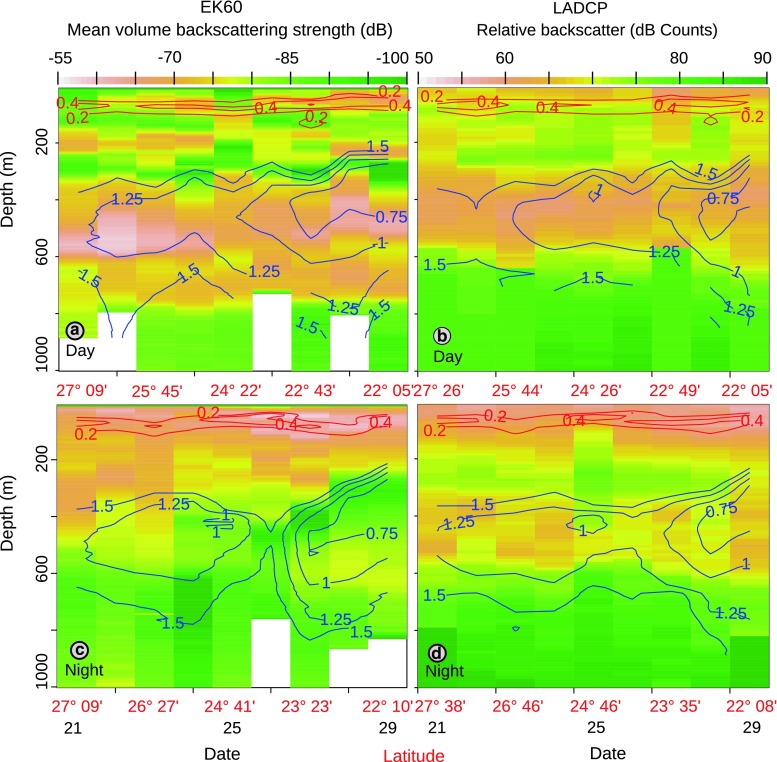
Fig. 3.
Level plots of acoustic biomass profiles (10–1,000 m). Days are plotted along the x-axis, with one observation per day (the latitudes of the CTD stations are given for every second date in red). The depth is plotted along the y-axis, and the colours correspond to amount of acoustic biomass. Absence of data is shown as white fields. Fluorescence (red) and oxygen (blue) concentrations are overlaid. Upper panels daytime data; lower panels night-time data. Left column EK60 data. Right column LADCP (300 kHz) data. In the EK60 plots, each horizontal pixel-column represents a daily profile. In the LADCP plots, each pixel horizontally represents a single CTD cast. For the EK60, the overlay values are from the CTD cast closest in time to the centre of the profile; in the LADCP plots, the overlay values are concurrent. Blue lines oxygen concentrations in mL L−1. The contour lines are 0.25 mL L−1 apart. Red lines: contours of fluorescence

