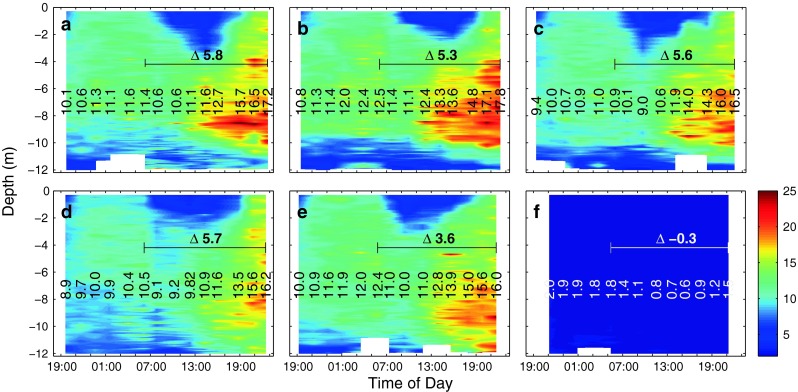
Fig. 2.

Measured vertical chlorophyll a (Chl a) distribution and change with time in mesocosms M6 (a), M4 (b), M3 (c), M5 (d), M2 (e) and the Baltic (f) as measured by a CTD-mounted sensor. These values were compared to depth-integrated (0–9.5 m) fluorometric Chl a determinations and corrected for an offset (see "Materials and Methods" for details). Vertical numbers denote average concentrations (μg l−1) between 0.3 and 11 m depth at each cast, while horizontal numbers indicate the absolute change in concentrations during the day. Note that the seemingly decreasing concentrations in the upper ∼5 m of the water column starting at dawn until about midday are caused by an attenuation of the chlorophyll fluorescence signal by sunlight and do not reflect actual changes in Chl a concentrations (Falkowski and Kolber 1995; Falkowski and Raven 1997)
