
Fig. 4.
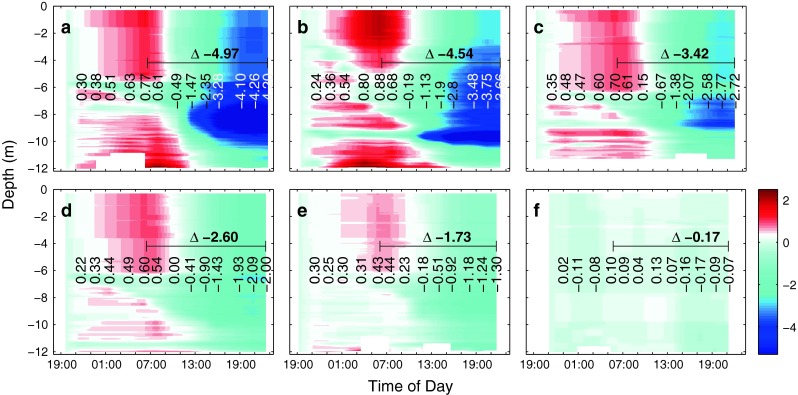
Calculated vertical concentration changes in free hydrogen ions, H+F (nmol kg−1), relative to starting conditions at about 19:00 in mesocosms M6 (a), M4 (b), M3 (c), M5 (d), M2 (e) and the Baltic (f). Concentration changes were calculated from pHT profiles (compare Fig. 3 and see "Materials and Methods" for details). Vertical numbers denote average free hydrogen ion concentration changes in the water column (0.3 and 11 m) relative to starting conditions at each cast. Horizontal numbers show the absolute concentration change during the day