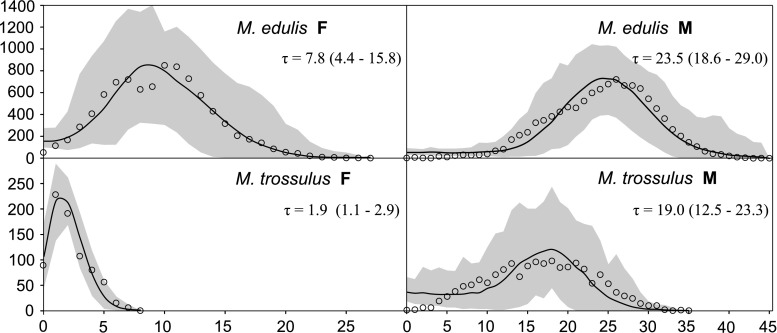
Fig. 3.
Mismatch analysis of selected groups of sequences. The data from Śmietanka et al. (2009) were analysed in the upper panels. Two well-defined Atlantic clades which experienced clear postglacial expansion were selected for this to serve as a reference point. For the M. trossulus data sets, two examples are presented in the lower panels. For the F genome, the small clade represented almost exclusively by Atlantic haplotypes with the characteristic star-like topology of several singleton haplotypes surrounding the central, more frequent (15 observations) haplotype (Fig. 1) was analysed. For the M genome, the whole Pacific data set was combined and analysed. In both cases, the inferred expansion is significantly more recent in the M. trossulus data set

