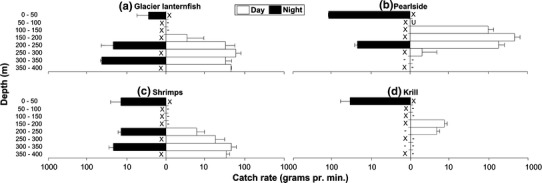
Fig. 2.

Vertical distribution of a glacier lanternfish, b pearlside, c shrimps and d krill caught during night and day, presented as catch in g min−1 trawling. The Standard deviations are illustrated by lines from the columns, except for the night catch in the depth interval 300–350 m, where the lines illustrate the maximum catch in the trawl tows (since only two successful samples were obtained). Dash indicates that catch is <1 g min−1, cross marks indicate no trawling during the day and night, while U indicates an unknown amount of pearlside larvae
