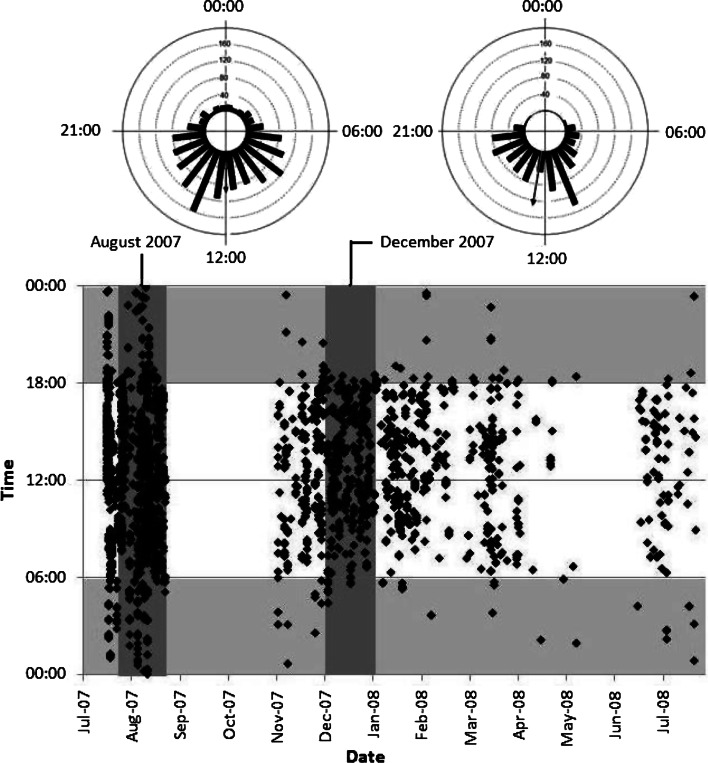
Fig. 8.
Sphyrna lewini. Scatterplot (below) of detections of hammerhead shark #10 at Shark Point, Wolf Island. Horizontal gray shading from 00:00 to 06:00 and from 18:00 to 00:00 denotes approximate nighttime period. Vertical shading displays data points used for circular analysis (above) of diel behavior for August 2007 (cool season) and December 2007 (warm season). For each circular graph, bars represent the number of detections in that hour during the month. The direction of the arrow shows the mean time, the length is the concentration

