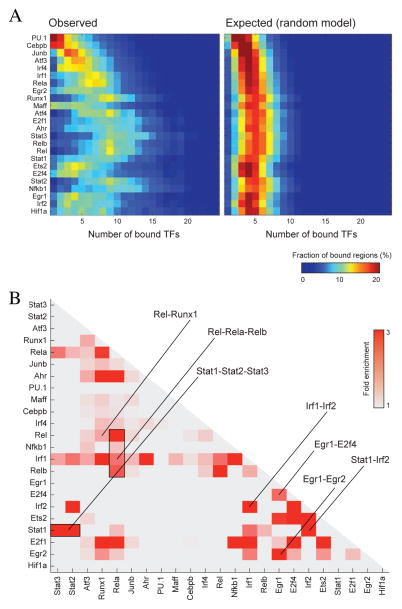
Figure 3. Co-binding of TFs in regulatory regions.
A. We define the TF complexity of a regulatory region as the number of TF bound to it (Roy et al., 2010). The heatmaps show for every TF a distribution of the complexities associated with its bound regions. The left heatmap shows the original data while the right heatmap is obtained from a random process in which the TF complexity of every region is proportional to its length (Methods). B. TF co-binding at similar regions. Significant TF pairs (p<10−3, Methods) are color-coded by their respective fold enrichment. Selected overlaps are highlighted.

