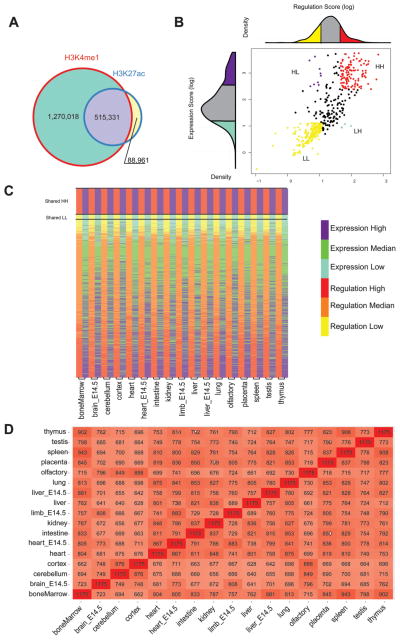
Fig. 1.
Genome-wide analysis of gene expression and regulation in topological domains. (A) Venn diagram showing the overlap between H3K4me1 and H3K27ac ChIP-seq peaks for all 17 tissues. (B) Graph showing how the olfactory topological domains were separated to four different types based on their gene expression and regulation scores. The regulation score for this tissue is shown above the x axis and the expression score in the y axis. (C) Heat map showing topological domain clusters for each tissue. High regulation scores are shown in red and low in yellow. High expression scores are depicted in purple and low in light blue (D) Overall similarity between domain type and the different tissues. The number of topological domains having a similar domain type between the different tissues is written for each tissue. The darker the color the more similar the tissues are.

