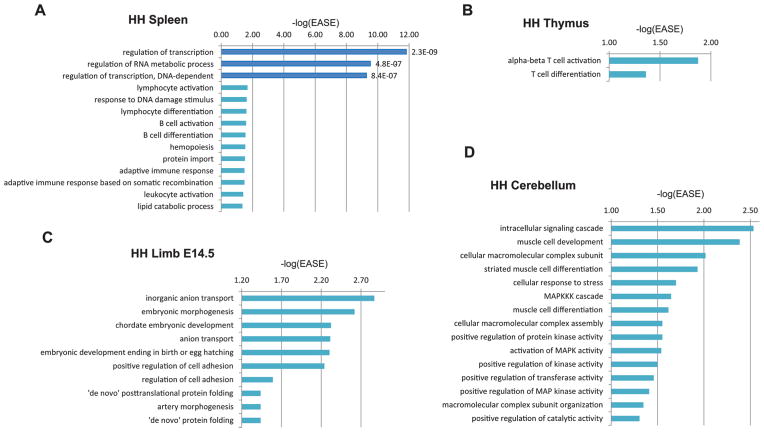
Fig. 3.
Tissue-specific topological domains with high gene expression and regulation (HH). (A) Enriched GO terms in spleen tissue-specific HH domains. (B) Enriched GO terms in thymus tissue-specific HH domains. (C) Enriched GO terms in E14.5 limb tissue-specific HH domains. (D) Enriched GO terms in cerebellum tissue-specific HH domains. Dark blue bars represent GO terms that have an FDR ≤ 0.05. −log(EASE) p values generated by DAVID (Huang et al. 2009a, 2009b) are shown in the x axis and to the right of each dark blue colored bar are its FDR p values.

