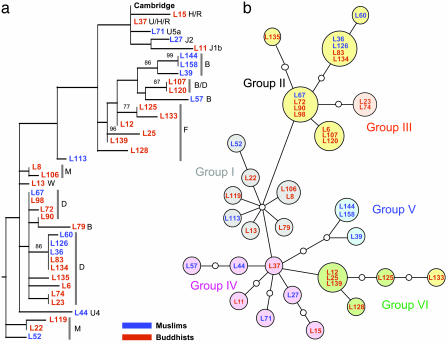
Fig. 1.
Phylogenetic analysis of mtDNA HVS1 sequences. The designations for individual probands consist of L plus an arbitrary number (followed by the haplogroup in a) and are color-coded as indicated. (a) Maximum-likelihood tree of the HVS1 sequences (388 bp) using a Tamura–Nei model of evolution (I = 0.4806; G = 0.7551; starting tree = neighbor-joining; nearest-neighbor interchange branch swapping limited to 20,000 rearrangements). Data were constructed by using paup* and bootstrapped with 1,000 replicates. Only bootstrap values >70% are shown. The tree includes the Cambridge Reference Sequence and was rooted with a pygmy sequence. (b) Phylogenetic network relating HVS1 sequences. Colors of the filled circles correspond to the six main radiation groups described in Oota et al. (38), and small open circles correspond to missing haplotypes. The network obtained from Ladakhi HVS1 sequences is completely congruent with the network of Oota et al. (38), except that proband L133 shares typical Group II variant sites (C at np362 and G at np319) but is placed at a terminal node of Group VI.

