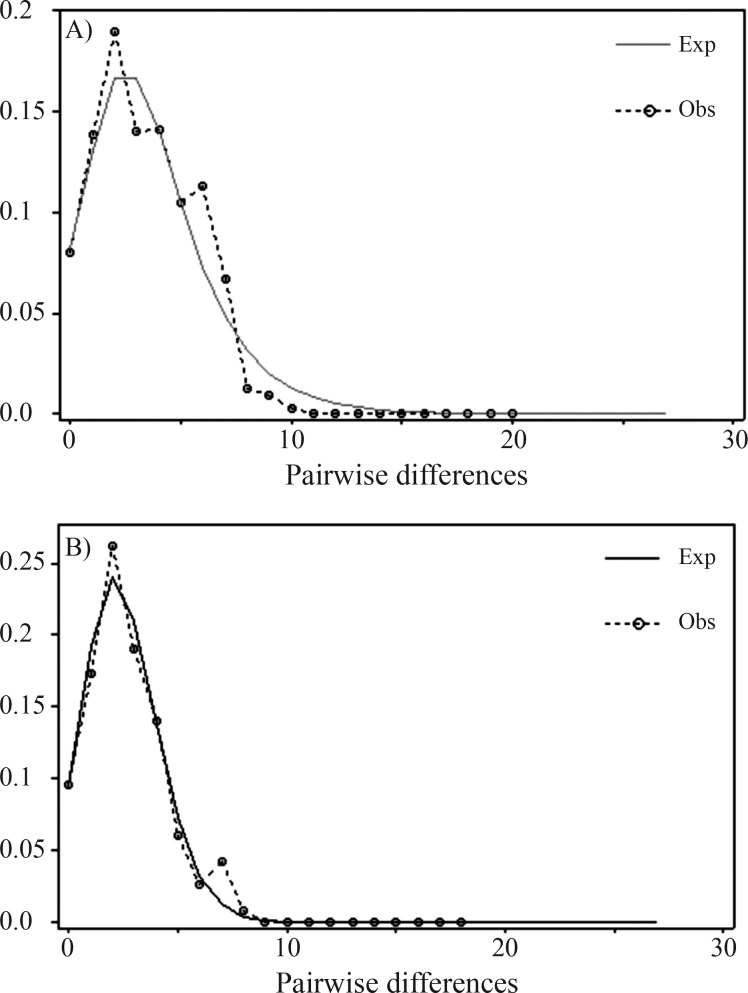
Figure 3.
Graphs depicting the results of the Mismatch Distribution analysis for the total sample (A) and South American samples alone (B). The analysis was performed with 669 bp of P. concolor ND5 sequences (excluding all sites with missing information or gaps). The dashed line represents the observed pattern, while the continuous line depicts the pattern expected under a model of sudden demographic expansion.

