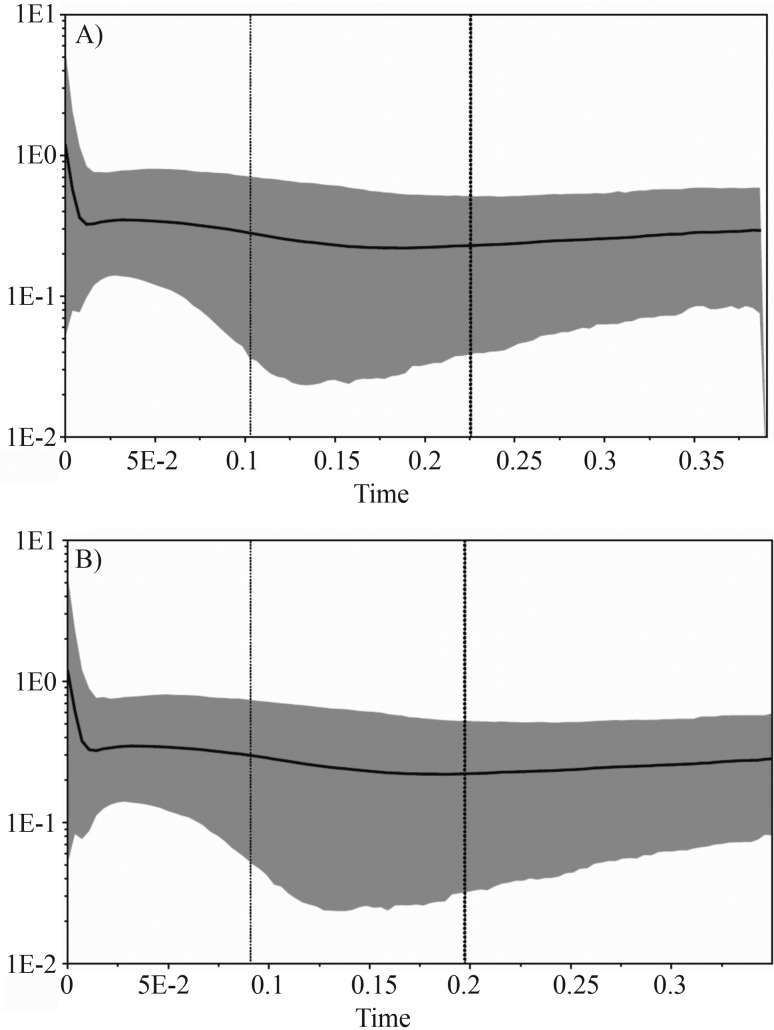
Figure 4.
Bayesian Skyline plots derived from an alignment of puma ND5 sequences. In (A) the analysis was run for all puma samples, and in (B) for South American pumas only. The thick solid line represents the mean, while the 95% HPD (highest posterior density) limits are shown by the blue areas. The vertical dashed lines refer to the tMRCA, with the thin line indicating the lower 95% HPD limit, and the thick line representing the mean. The x-axis is depicted on a scale of millions of years (myr). The y-axis represents the effective population size (Ne) multiplied by the generation time (also in myr). Assuming a generation time of 5 years, the numbers on this axis should be multiplied by 200,000 to yield interpretable values.

