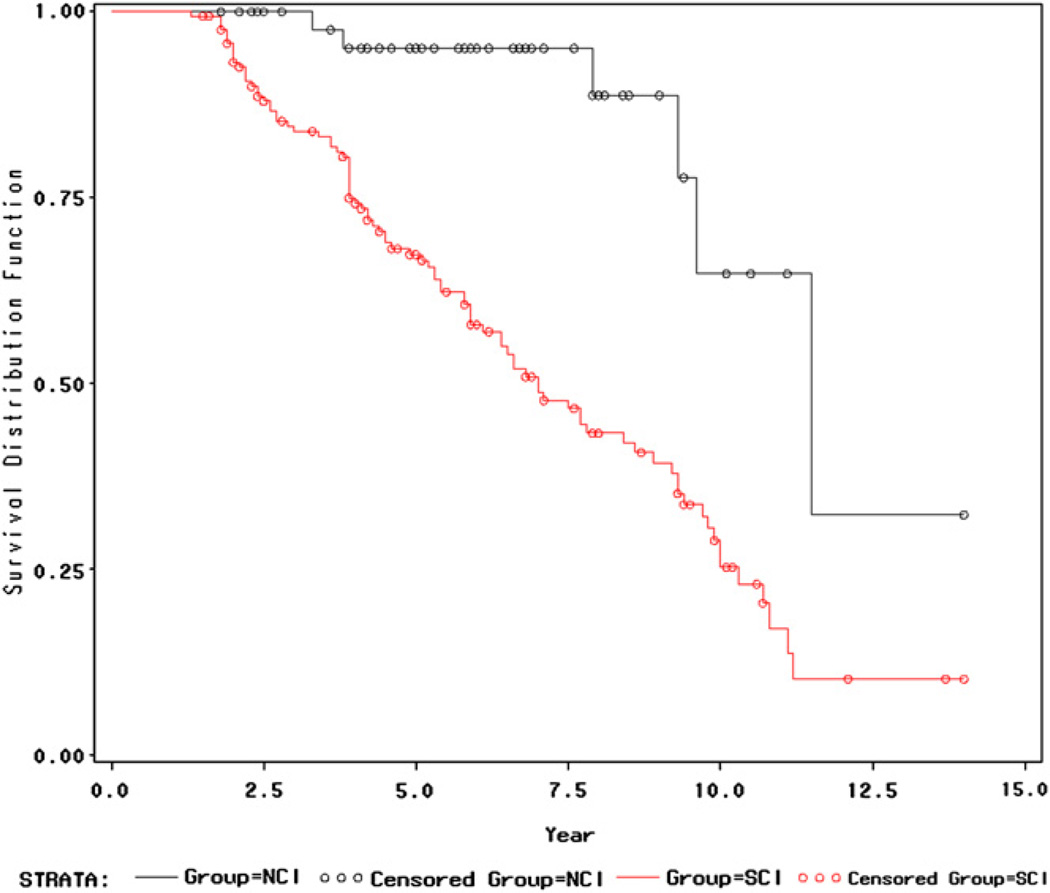
Fig. 1.
Plot of survival distribution functions for the NCI and SCI baseline groups. The y-axis is the probability of not declining to MCI or dementia. The x-axis is the time (in years) to decline. This survival curve plot extends until observation year 14. There were no SCI subject observations beyond year 14. One NCI subject was followed up beyond year 14. This subject was observed to decline at year 16. There was a significant difference between the NCI and the SCI baseline groups in the survivor function of absence of decline to MCI or dementia in favor of the NCI baseline group (P < .0001, Wilcoxon test and Log-Rank test).

