
Fig. 3.
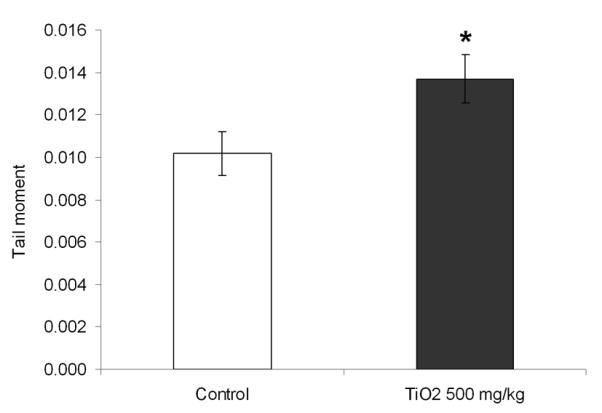
Frequency of DNA strand breaks in mice before and after treatment with 500 mg/kg TiO2 NPs. DNA damage is represented by the Tail Moment. Mean ± SEM, n= 5 mice/group is shown, *, p < 0.05, compared with untreated mice.
Official websites use .gov
A
.gov website belongs to an official
government organization in the United States.
Secure .gov websites use HTTPS
A lock (
) or https:// means you've safely
connected to the .gov website. Share sensitive
information only on official, secure websites.
Frequency of DNA strand breaks in mice before and after treatment with 500 mg/kg TiO2 NPs. DNA damage is represented by the Tail Moment. Mean ± SEM, n= 5 mice/group is shown, *, p < 0.05, compared with untreated mice.