
Fig. 4.
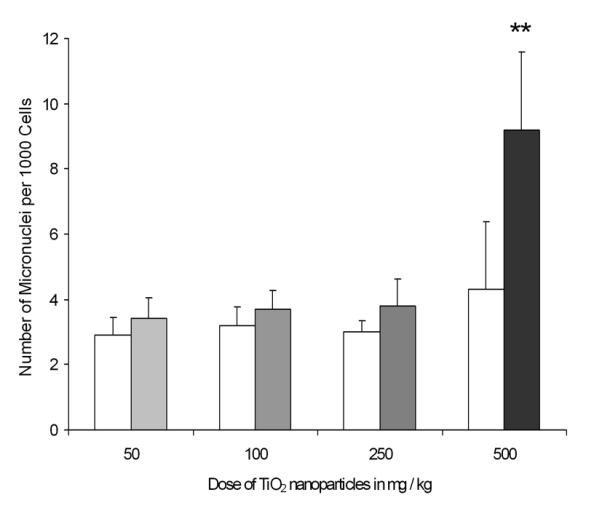
Frequency of MN in mice before and after TiO2 NPs treatment in peripheral blood erythrocytes. Open bars represent untreated controls and grey bars represent TiO2 NPs treated mice. Each bar represents the mean of 5 mice ± SEM., *, p < 0.01 compared with untreated mice.