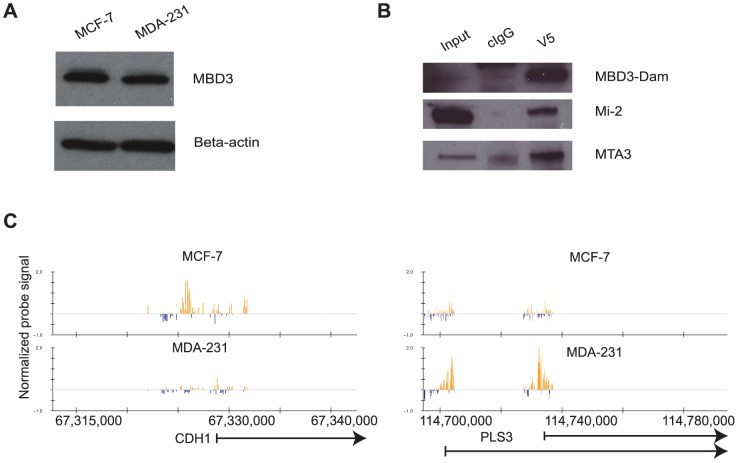
Figure 1. The DamID platform for location analysis of human MBD3.
A. MCF-7 and MDA-231 cells express endogenous MBD3 at equivalent levels. The immunoblot depicts endogenous MBD3 protein expression in MCF-7 and in MDA-231 cells. Beta actin is included as a control. B. Dam-fused MBD3 can be incorporated into the NuRD complex. An IP-western analysis was performed on lysates from HeLa cells infected with the pLgw-MBD3-V5-EcoDam using V5 antibody or control IgG. The resulting immunoprecipitates were compared to input lysates and probed for MBD3-Dam fusion and endogenous Mi-2 and MTA3. C. Genome browser (hg18, http://genome.ucsc.edu, [53]) views of exemplar genes analyzed by DamID. The location of genes is indicated at the bottom of the respective panels. Normalized probe signal within the regions displayed is indicated above the genomic coordinates (hg18).

