
Figure 3. MBD3 localizes in a cell-type specific manner by ChIP-seq.
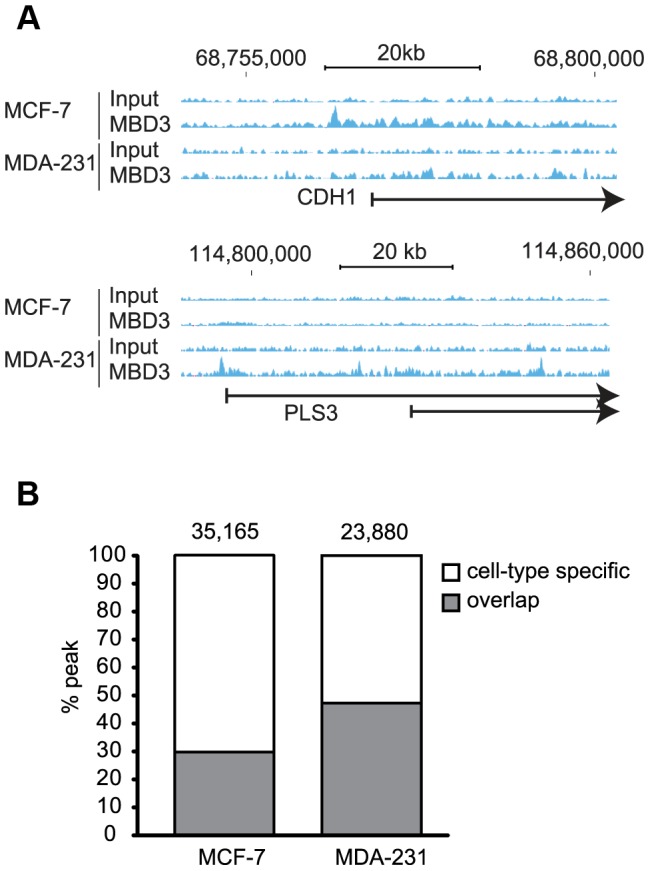
A. Exemplar loci are depicted in genome browser format (hg19, http://genome.ucsc.edu, [53]). Individual sequencing tracks are indicated to the left of the browser view. Genomic intervals and scale bar are indicated above the tracks. B. The column graph depicts the total number of peaks defined from the current study in each cell type. The colors depict peaks that overlap in the two cell types by at least one base as well as those with no overlap (cell-type specific in the figure).