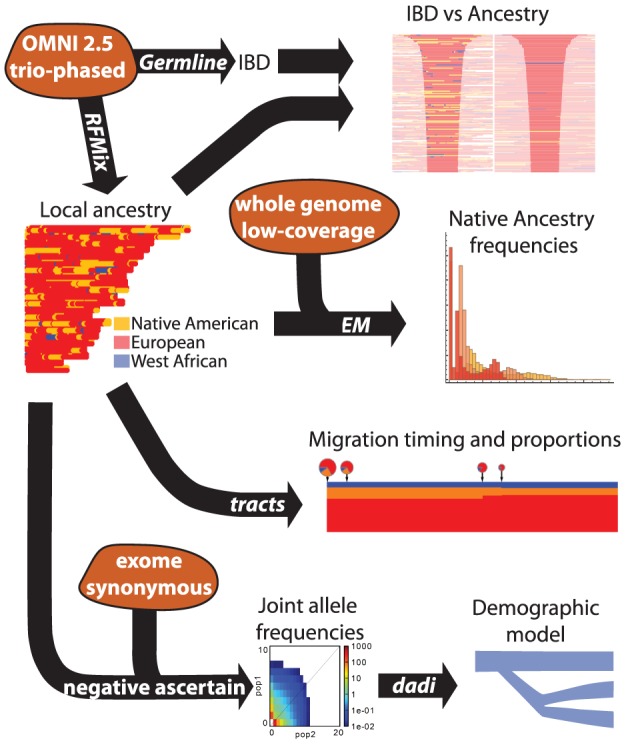
Figure 1. Schematic of the data and analysis pipelines used in this article.

The three types of 1000 Genomes data are shown in orange: whole-genome, low-coverage data; exome capture; and genotyping chip. Only genotyping chip data was available in trio-phased form; for the other two datasets we used unphased genotypes. Among the analysis approaches (black arrows), the EM and the negative ascertainment analysis are novel: they are presented in the Methods section.
