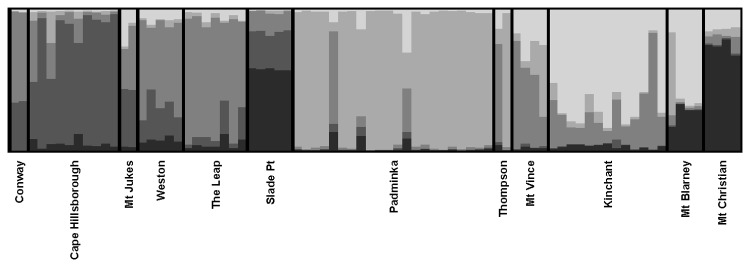
Figure 1. Genetic clustering analysis for Mackay (K=5) samples.

Different grayscales represent the five different genetic clusters. Individuals are grouped by location and are represented by columns and the proportion of each grayscale in a column represents their proportional assignment to a cluster. Locations are arranged north to south (left to right).
