
Figure 4. Mean relatedness for sample locations in Brisbane.
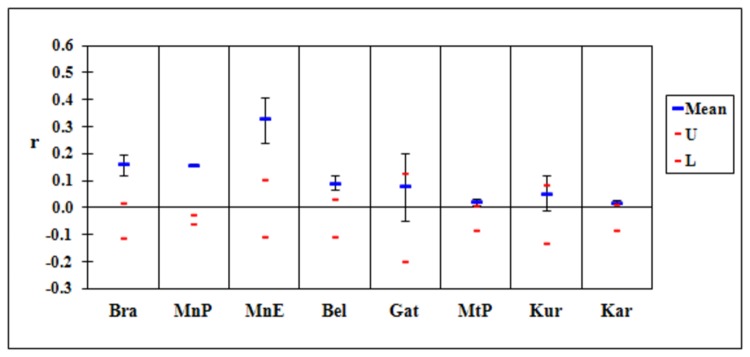
Mean values above the red lines for Bra, MnP, MnE and Bel indicate relatedness is higher than expected.
Official websites use .gov
A
.gov website belongs to an official
government organization in the United States.
Secure .gov websites use HTTPS
A lock (
) or https:// means you've safely
connected to the .gov website. Share sensitive
information only on official, secure websites.
Mean values above the red lines for Bra, MnP, MnE and Bel indicate relatedness is higher than expected.