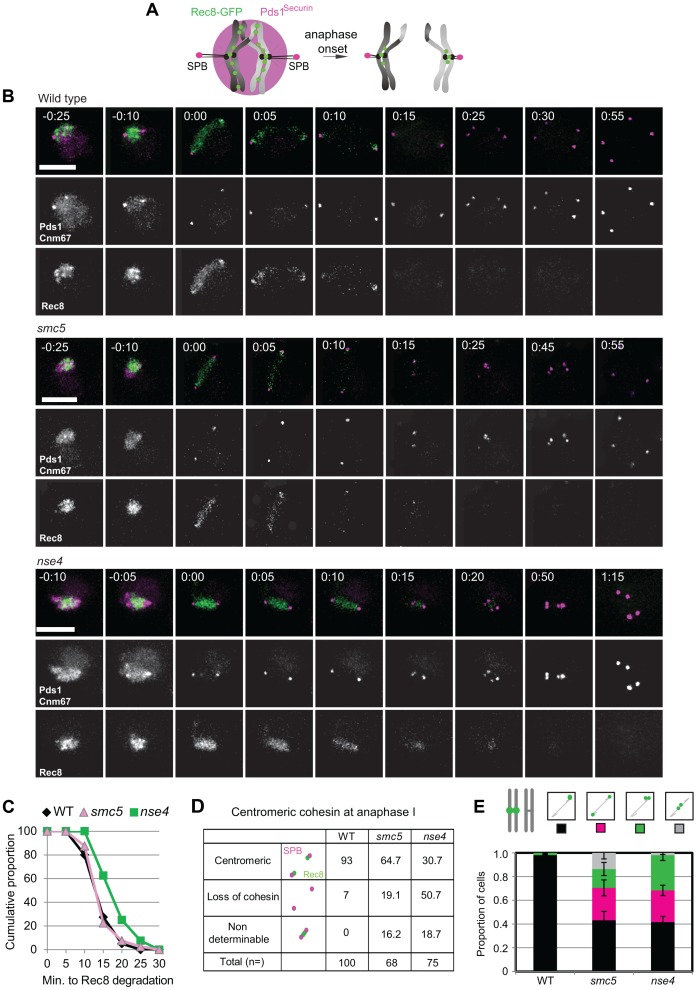
Figure 9. Misregulation of cohesin in smc5/6-depleted cells.
(A) Experimental set up: Spindle pole body component CNM67-mCherry and Pds1Securin-tdTomato were used to assess spindle length and the onset of anaphase I, respectively. Rec8 is tagged with GFP. Upon anaphase I onset, Pds1Securin-tdTomato is degraded, the distance between CNM67-mCherry foci increase, and Rec8-GFP is degraded along arm regions until only centric and pericentromeric cohesin is left (right hand diagram). (B) Typical examples of time lapse images from wild type and the two mutants. Bars: 4 µm. Arrows indicate loss of centromeric cohesin signal. Note that the temporal resolution of kinetics is limited to 5 min. Strains: WT (Y2572), smc5 (Y2673), and nse4 (Y3047). Full movies are available in the Supplemental Information (Movies S5, S6, S7). (C) The cumulative proportion of cells with arm cohesin has been degraded at the given time after anaphase I onset (n≥40 per strain). Significance tests for Kruskall-Wallis (P<0.01) show nse4 is delayed compared to wild type and smc5. (D) Proportions of nuclei with centromeric cohesin at anaphase I from live-cell imaging experiments. Anaphase I was staged by loss of Pds1 signal. (E) Analysis of sister kinetochore separation. tetO repeats are inserted 1.5 kb from CEN5 and tetR-GFP expressed constitutively. Only one homolog contains the tetO-CEN5 insertions, which allows analysis of sister kinetochore behaviour. Bars represent standard error (n>100 for each strain). Anaphase I was staged by spindles being greater than 4 µm in length. At this length, all spindles from smc5 and nse4 were Pds1 negative (data not shown). WT (Y2708), smc5 (Y2709), and nse4 (Y3071).

