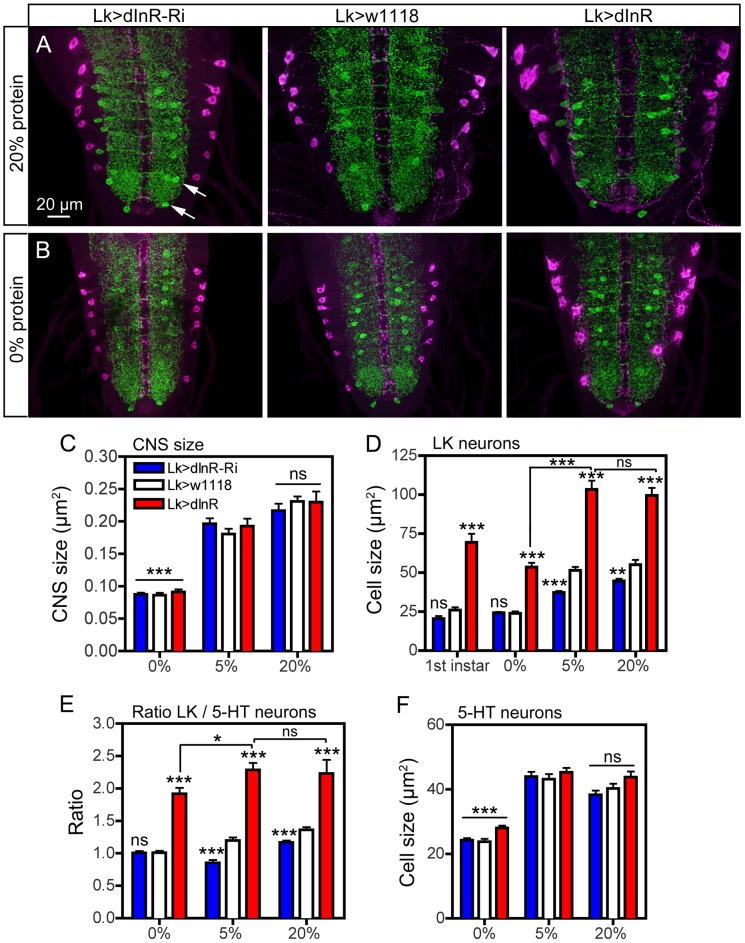
Figure 11. Effects of diet on size of ABLK neurons.
Larvae of different genotypes were reared on three different diets: 20% sucrose with either 0%, 5% or 20% protein (yeast) as detailed in the scheme in Fig. S15A. Late third instar larvae were labeled with anti-LK (magenta) and anti-5-HT (green). Statistics: *p<0.05, **p<0.01, ***p<0.001, n = 6–12 larvae for each genotype from 3 crosses; unpaired Student's T-test for comparison of genotypes; Two-way Anovas for comparisons of diet effects). A and B Manipulation of dInR expression in LK neurons affects the size of ABLK neurons in larvae fed protein-rich (20%; A) and protein-free (0%; B) and normal (5%; not shown) diet. Cell bodies of 5-HT immunolabeled neurons (arrows in Fig. 11 A) are used for reference. The size changes in CNS and different neurons are quantified in Fig. 11 C–F (cell bodies are shown in higher magnification in Fig. S15 B). C The low protein (0%) diet significantly (p<0.001) affects the size of the entire CNS compared to “standard diet” (5%), whereas 20% protein does not increase the CNS (ns; p>0.05). Note that the CNS size is not affected by the dInR manipulations. D Quantification of ABLK cell body size in third instar larvae fed the three different diets, compared to those in first instar larvae (genotypes as in C). Under 0% protein conditions all genotypes display third instar ABLK cells with sizes corresponding to those in first instar larvae. These are significantly smaller than in flies fed 5% and 20% protein (p<0.001 for all genotypes compared for 0% and 5% protein; Two-way Anova). Larvae fed protein-rich food (20%) do not display increased ABLK cell bodies compared to those fed 5% protein. The significance values indicate differences to control flies (Lk>w1118) for each protein condition (*p<0.05, **p<0.01, ***p<0.001, ns, not significant, n = 6–10 larvae for each genotype from 3 crosses; unpaired Student's T-test) and comparisons between protein diets for dInR overexpression (Two-way Anova). E The ratio between the ABLK cell size and the size of 5-HT neuron cell bodies in corresponding abdominal neuromeres (same protein conditions and genotypes as in C). These were determined to establish whether the ABLK size is affected disproportionally by protein diet (the size of the 5-HT neuron cell bodies for the three protein diets are shown in F). It can be seen that with 5-HT cells as size reference the dInR overexpression only marginally (p<0.05; Two-way Anova) increased the ABLKs after dInR overexpression when comparing 0% and 5% (and 20%) protein. For each diet dInR over expression significantly increases the ratio between ABLK and 5-HT cell body sizes compared to control flies. Only small (but significant) effects can be seen after dInR-RNAi in 5% and 20% diets. F Size of cell bodies of 5-HT immunolabeled neurons in abdominal ganglia in larvae reared in the three different diets (genotypes as in C). Note that manipulations of the dInR in LK neurons do not affect the 5-HT neurons, but 0% protein diet results in significantly smaller cell bodies compared to 5% and 20% protein.

