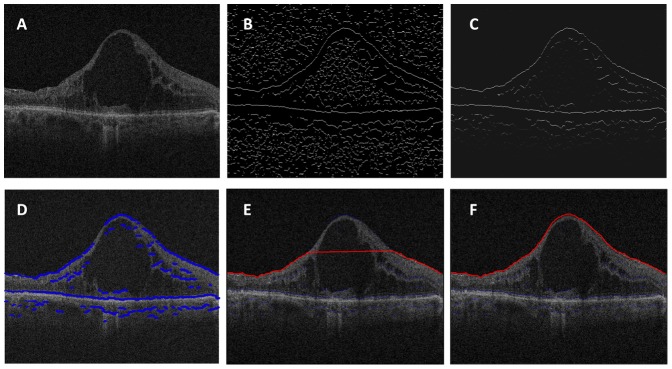
Figure 2. Graphic representation of segmenting the inner limiting membrane (ILM) interface in a representative B scan using the EdgeSelect method.

(A) A representative OCT B scan. (B) Detection of image contrast change using zero-crossing of a Laplacian-of-Gaussian (LoG) filter. (C) The detected edges are assigned different weights based on intensity/gradient characteristics. Higher intensity represents larger weight, corresponding to strong edges; lower intensity signals are assigned lesser weight corresponding to weak edges. (D) An edge candidate map (blue lines) is generated using a Canny-like filtering scheme, and is superimposed on the original OCT image. (E) The start and end edge candidates are initiated, and the path of the shortest distance via Dijkstra's algorithm (red line) is computed. (F) Human grader intervention adds additional seed edges, and the program regenerates automatically the updated shortest path until the proper layer segmentation is reached.
