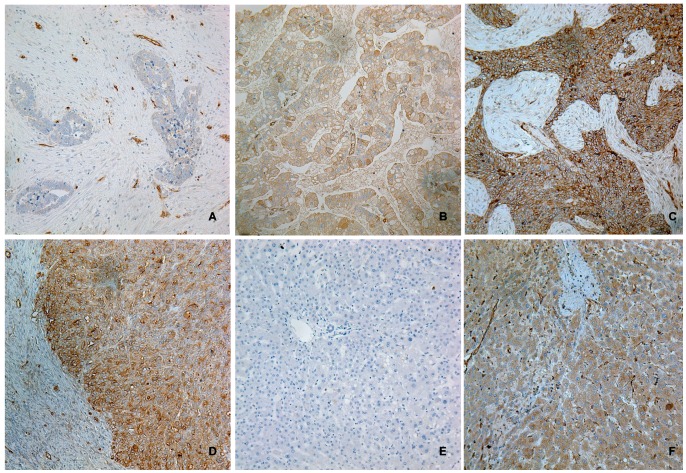
Figure 2. IHC SHBG staining in clinical ovarian carcinoma samples.
Representative weak (A), moderate (B, moderately differentiated tumor) and strong (C, poorly differentiated tumor) are shown. Stronger SHBG immunostaining is shown at the invasive front of a poor-differentiated ovarian carcinoma (D). Negative control performed in human liver tissue with the same concentration of non-immune goat IgG shows no staining in the liver cells (E). Positive control performed with liver tissue shows the positive cytoplasm SHBG staining. Endothelial cells are also positive for SHBG. All photos were taken at 200×.

