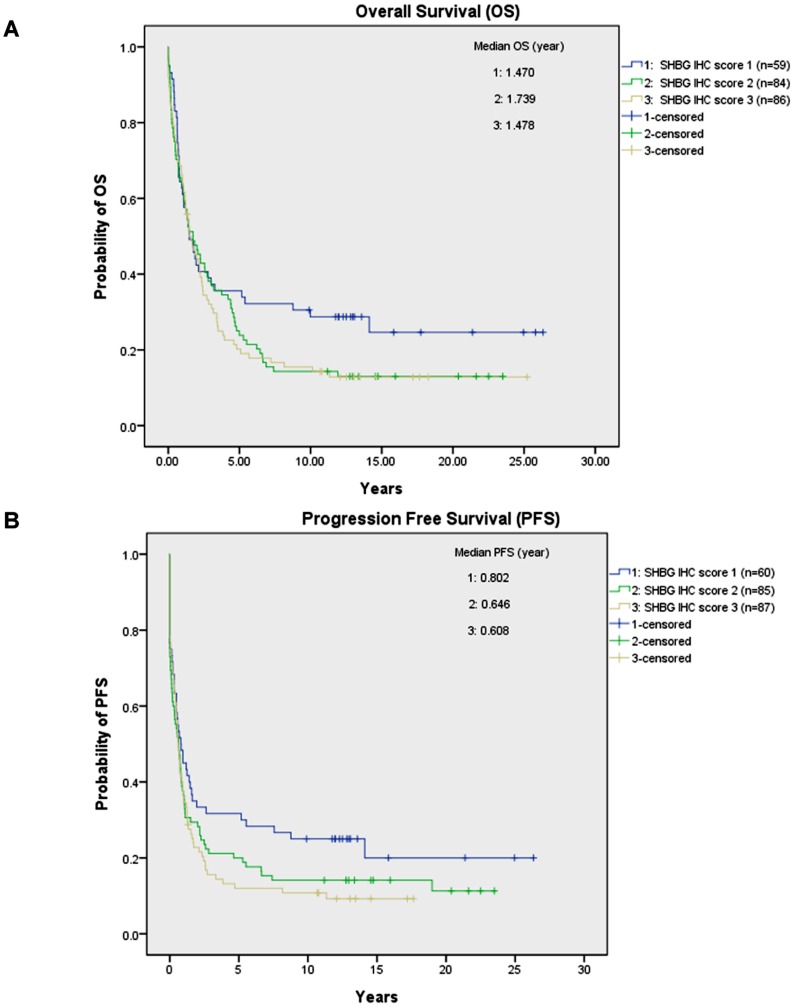
Figure 3. OS and PFS for the ovarian carcinoma patients in 3 SHBG IHC groups.
For both OS (A) and PFS (B) curves, weakly (IHC score 1), moderately (IHC score 2) and strongly (IHC score 3) SHBG expressing groups were marked by blue, green and brown lines respectively. No statistically significant difference was obtained both for OS (p = 0.220) and PFS (p = 0.132).

