
Figure 6. Levels of p53 under T-2 toxin stress.
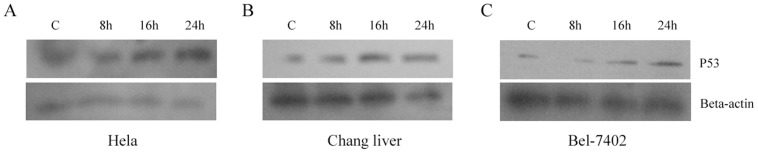
A. Levels of p53 in Hela cells when treated with T-2 at the concentration of LC50 for 8, 16, and 24 h respectively. B. Levels of p53 in Changliver cells. C. Bel-7402 cells were treated with T-2 Toxin.
Official websites use .gov
A
.gov website belongs to an official
government organization in the United States.
Secure .gov websites use HTTPS
A lock (
) or https:// means you've safely
connected to the .gov website. Share sensitive
information only on official, secure websites.
A. Levels of p53 in Hela cells when treated with T-2 at the concentration of LC50 for 8, 16, and 24 h respectively. B. Levels of p53 in Changliver cells. C. Bel-7402 cells were treated with T-2 Toxin.