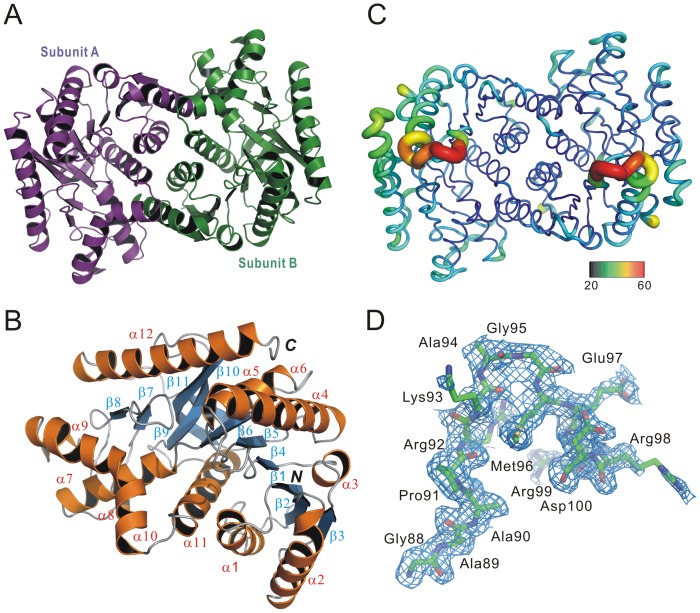
Figure 4. Crystal structure of TtMDH.
(A) Ribbon drawing shows 2 monomers related by a pseudo-two-fold. Each monomer consists of 12 helices and 11 strands. (B) Subunit A structure of TtMDH shown as a ribbon representation by 90° rotation around the Z-axis. Secondary structure elements are numbered sequentially as α1–α12 and β1–β11 for the common α-helices and β-strands, respectively. N and C refer to N- and C-terminal regions, respectively. (C) Sausage representation colored by B-factor. The color range bar represents the B-factor scale from 20 (blue) to 60 (orange) Å2. (D) Representative 2Fo-Fc electron-density maps contoured at 1σ.

