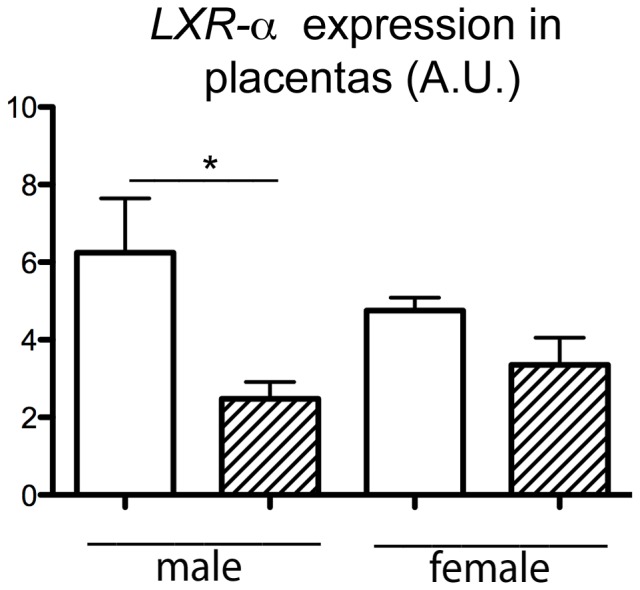
Figure 7. Relative expression of LXR-α expressed in arbitrary unit (A.U.) in HH and C placentas, according to sex.

N = 5 per group. HH is indicated in hatched columns and C diet by white columns.

N = 5 per group. HH is indicated in hatched columns and C diet by white columns.