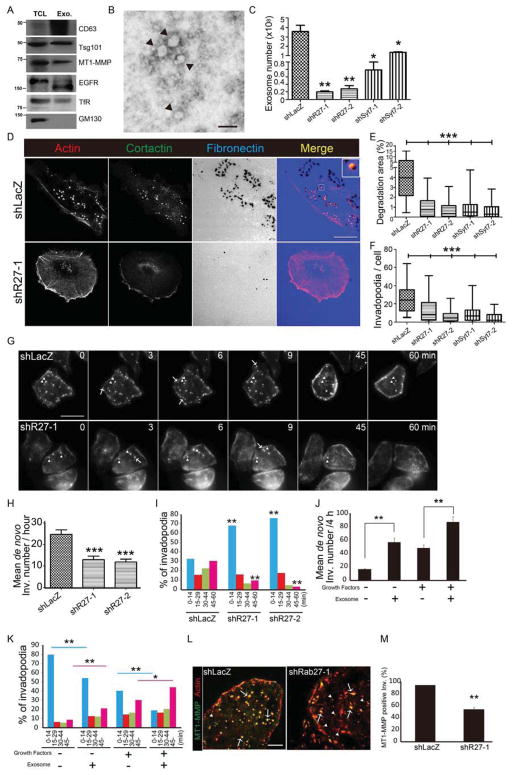
Figure 2. Exosome secretion promotes invadopodia formation and maturation.
(A) Western blot analysis of proteins in SCC25-H1047R total cell lysates (TCL) and exosomes (Exo.). (B) Negatively stained EM image of purified exosomes (indicated by arrowheads). Scale bar=100 nm. (C) NanoSight quantification of exosome numbers purified from cell culture supernatants from 3 independent experiments. Mean+/−SEM. (D) Images of SCC25-H1047R control (shLacZ) and Rab27a KD cells (shR27-1) cultured on FN (blue) coated gelatin plates and immunostained for cortactin (green) and F-actin (red). Scale bars=20 μm. n > 53 cells per cell line from 3 independent experiments. (E) Quantification of invadopodia mediated ECM degradation (% cell area). (F) Quantification of invadopodia number per cell. Data plotted as box-and-whiskers plots. (G) shLacZ and shR27-1 cells expressing F-tractin were plated on FN-coated gelatin plates for live imaging (1 frame per 90 s for 60 min). Arrowheads: stable invadopodia, Arrows: newly formed invadopodia. Scale bar, 20 μm. n>30 cells per cell line from 5 independent experiments. (H) Rate of invadopodia formation from movies. (I) Invadopodia lifetime, quantitated as length of time an invadopodia persists after formation. Asterisks show statistical comparisons to similar time bins in shLacZ control cells. (J,K) SCC25-H1047R shLacZ expressing F-tractin were cultured on FN-coated gelatin plates with or without growth factors before adding 2 × 10⁶ exosomes derived from SCC25-H1047R cells stably expressing GFP-CD63. After 1 h, live movies (Movie S4) were obtained as in (G). (J) Rate of invadopodia formation. (K) Invadopodia lifetime. n>13 cells per condition from 3 independent experiments. Pink and blue lines indicate statistical comparisons between pink and blue bars in graph. (L) TIRF images of shLacZ and shR27-1 cells stably expressing F-tractin (red, “Actin”) and transfected with MT1-MMP-pHluorin (green, “MT1-MMP”). Arrowheads indicate actin only and arrows show MT1-MMP-positive actin puncta. Scale bar=10 μm. n>10 cells per condition from 3 independent experiments. (M) Quantification of % MT1-MMP-positive invadopodia. * p<0.05, **, p<0.01, ***p<0.001. See also Figure S1.

