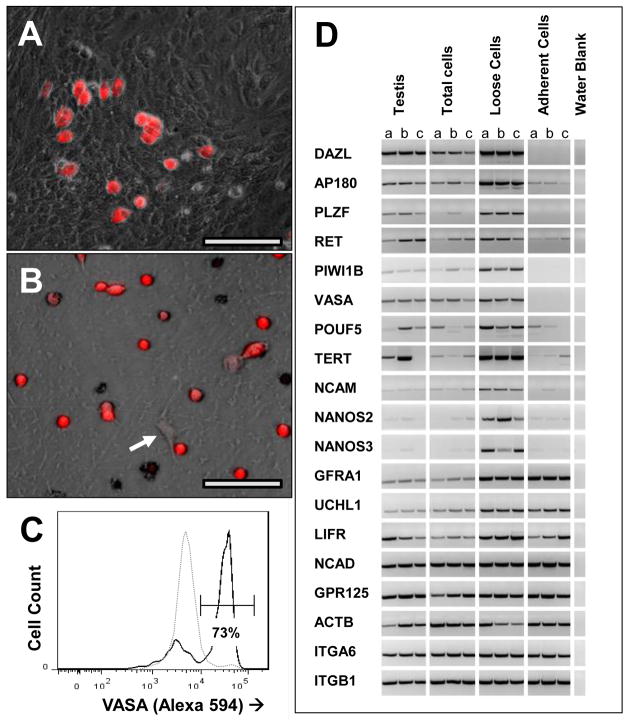
Figure 4. Enrichment of SPG by differential adhesion.
(A) Composite phase/ fluorescent image of 3 day testis cell culture before harvest of SPG. VASA-positive cells are shown in red. (B) Final preparation of SPG after harvest of “loose” cells from 3-day culture, and 2 rounds of differential adhesion to gelatin. The isolated cells were allowed to adhere to a laminin surface, and were then probed for VASA by immunofluorescence. The arrow indicates a VASA-negative fibroblast. (C) FLOW data showing VASA immunofluoresence before and after enrichment of SPG by differential adhesion. Dotted line: unfractionated testis cells, collected at day 3 of culture, prior to removal of “loose” cells. Cells (which had fully emerged from tubule structures by this time) were re- suspended by trypsin. Solid line: enriched SPG (loose cells), after 2 rounds of depletion of adherent cells from duplicate 3-day culture. Both cell populations were prepared for FACS analysis of VASA expression as described in Methods. (D) Co-enrichment of SPG -specific transcripts with the “loose” cell population. Candidate SPG -enriched transcripts were amplified by RTPCR from ACTB-normalized cDNAs extracted at three days of culture from total testis cells, enriched SPG (loose cells) and remaining adherent cells. ACTB RTPCR was included as an internal control. Each panel of 3 lanes represents three RTPCRs of 3 separate cell preparations derived from the same set of three donor testis cell suspensions. Lane a is from a 16 week old Black Lab. Lanes b and c are from 10 week old German Sheppard littermates. Primers are listed in Supplemental Table III. Bars = 50 um.

