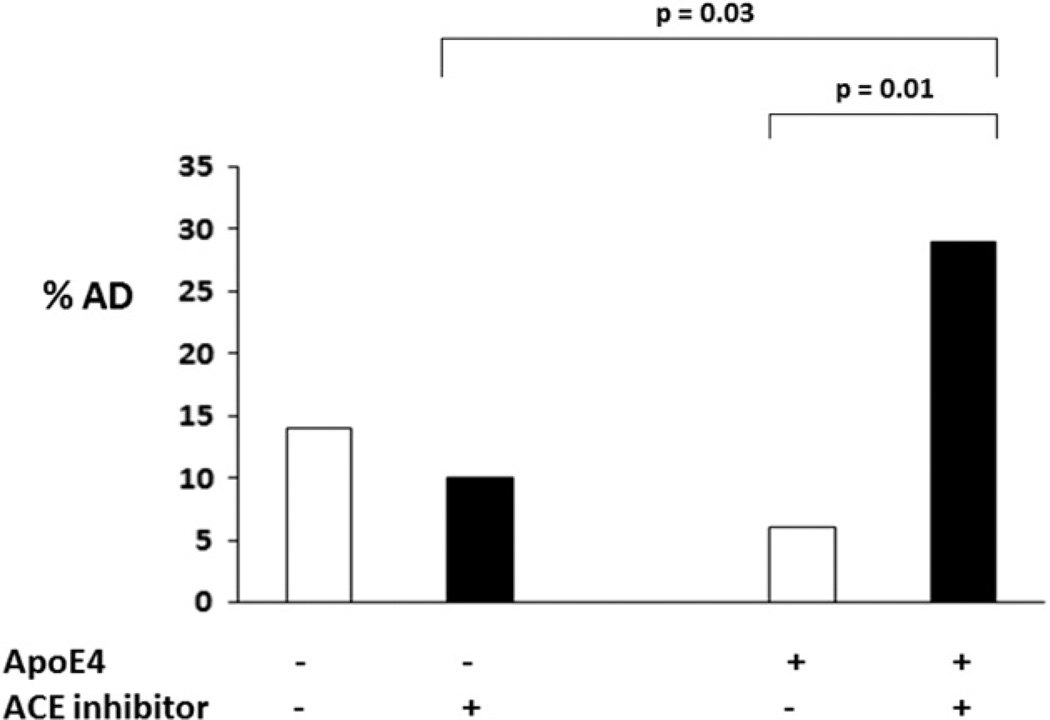
FIGURE 1. Alzheimer disease among those with and without the ACE treatment in the absence and presence of ApoE4 allele.
The percentages of AD were compared between different subgroups: in the absence of ApoE4 (ApoE4 −) or presence of ApoE4 (ApoE4 +) and further divided into no ACE inhibitor use (ACE inhibitor −) and ACE inhibitor use (ACE inhibitor +). Chi square (χ2 test) was used to compare between any two subgroups or among the four subgroups. p values for the statistical significance between the two subgroups are shown. In the presence of ApoE4, those who were on an ACE inhibitor had a significantly higher number of AD cases than those who were not (χ2 test: 28% versus 6%, DF = 1, χ2 = 8.02, p = 0.01). Among all the elderly who were on ACE inhibitors, ApoE4 carriers had more AD cases than the ApoE4 non-carriers (χ2 test: 28% versus 10%, DF = 1, χ2= 6.21, p = 0.03)

