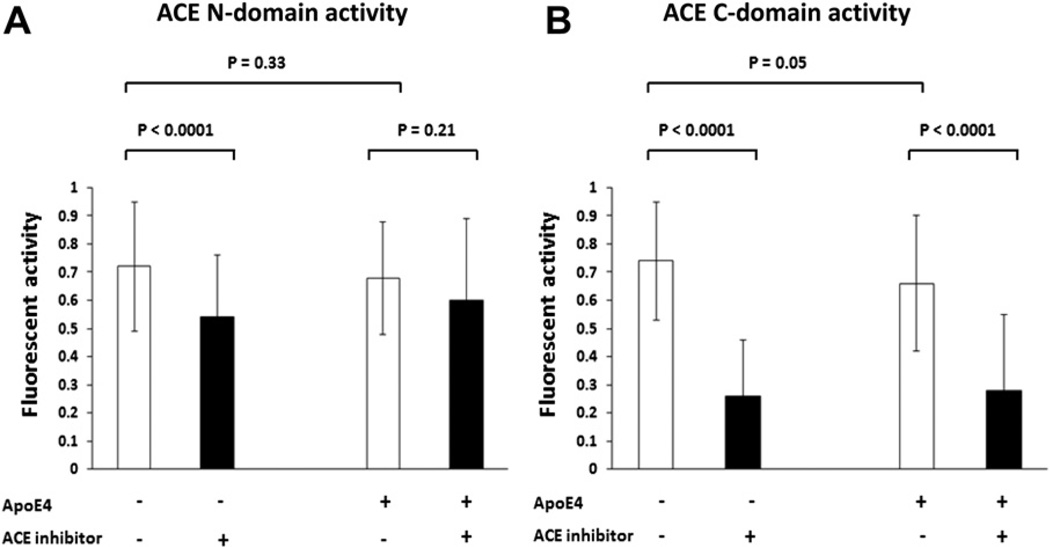
FIGURE 2. Characterization of ACE activity in the serum samples.
6-µL human serum was incubated with fluorogenic substrates specific for either ACE N-domain (A) or C-domain (B) at 37°C for 24 hours and the generated fluorescence were measured. The ApoE4 status and ACE inhibitor usage for each subgroup are illustrated. Mean ± SD of fluorescence with t test used to compare the differences between any two subgroups, DF = 1 and p values for the statistical significance are shown.

