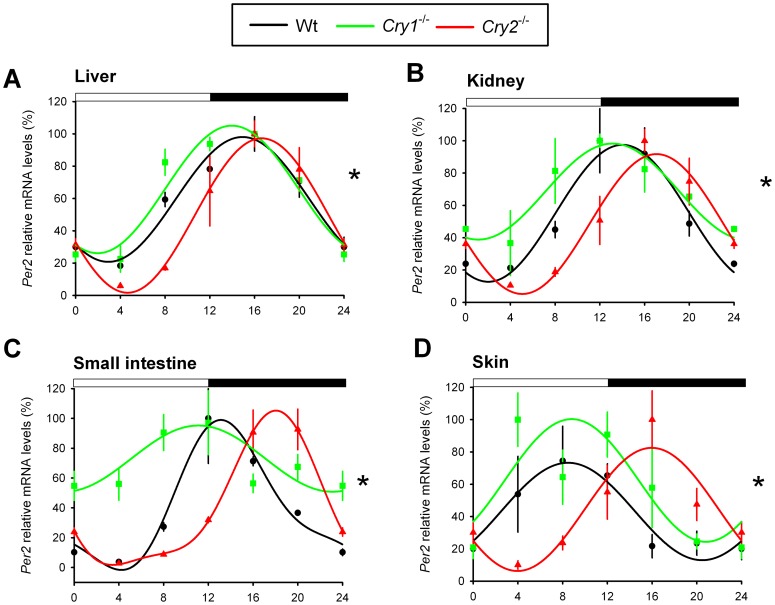
Figure 4. Per2 expression profiles in peripheral tissues of light-entrained Cry1-/- and Cry2-/- mice.
Relative mRNA expression profiles of Per2 in the liver (A), kidney (B), small intestine (C), and skin (D) of light-entrained (LD 12:12) wild type (black), Cry1-/- (green) and Cry2-/- (red) mice, as measured by RT-qPCR. For each genotype, mRNA levels (mean ± s.e.m) are expressed relative to the peak of expression (set at 100%) and fitted with a wave curve. The two-way ANOVA test revealed a significant effect of genotype and time interaction (*p<0.05). Data at ZT0 and ZT24 are double-plotted for easier visualization of daily expression. The bar above panels indicates time of light on and off.

