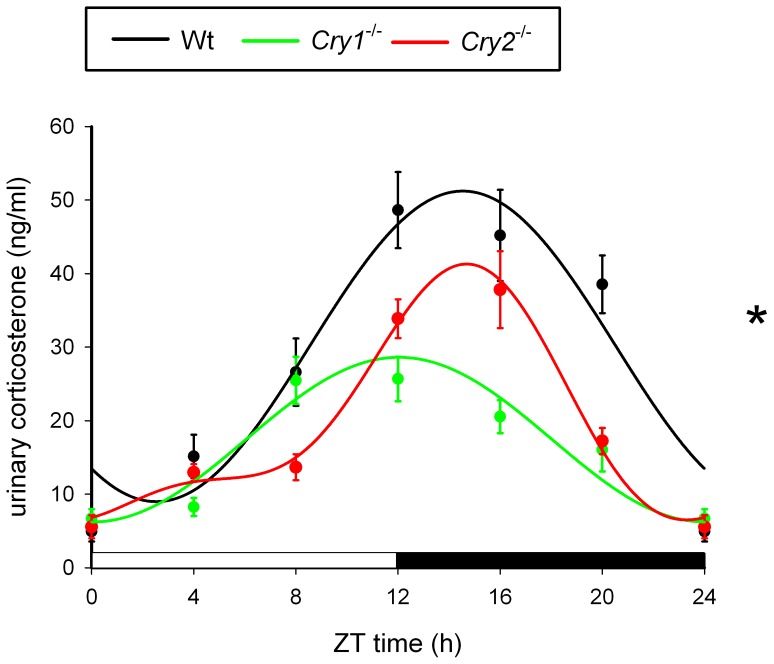
Figure 6. Circadian profiles of urinary corticosterone in Cry1-/- and Cry2-/- mice.
Urine was collected at 4(black), Cry1-/- (green), and Cry2-/- (red) mice (± s.e.m; n = 8 per genotype). Data were fitted with a wave curve and analysis of variance revealed significant difference among genotypes (p<0.001). Data at ZT0 and ZT24 are double-plotted for easier visualization of daily expression. The bar below panel indicates lights on and off.

