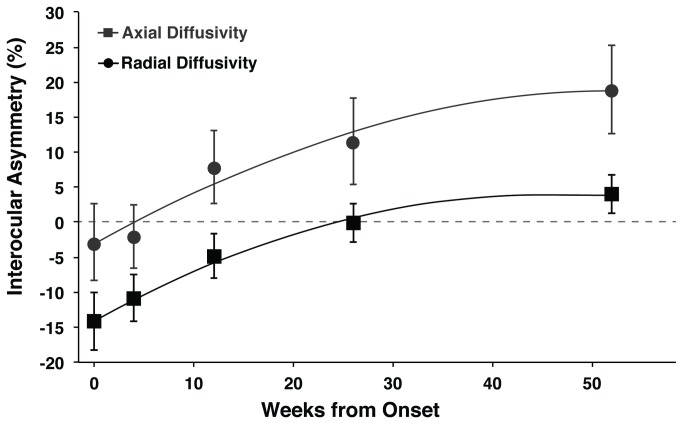
Figure 1. Timecourses for axial and radial diffusivity asymmetry over 12 months.
Both timecourses were fit with quadratic lines of best fit (AD: y = -0.007x 2 + 0.81x - 3.3; RD: y = -0.008x 2 + 0.77x - 13.8). Error bars indicate 95% confidence intervals for the mean.
* Significant interhemispheric asymmetry in axial diffusivity (p<0.05).
# Significant interhemispheric asymmetry in radial diffusivity (p<0.05).
UE = Unaffected Eye.

