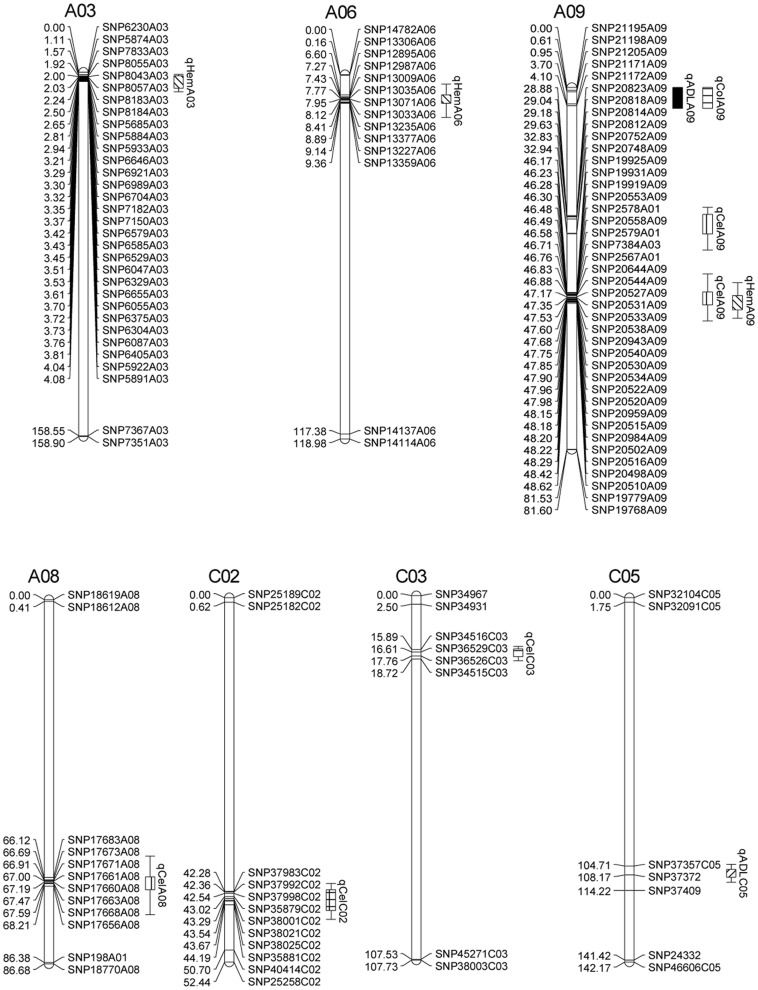
Figure 3. Locations of significant QTL for acid detergent lignin (ADL), cellulose (Cel), hemicellulose (Hem) and seed colour (Col) in four different environments on the high-density SNP map.
For simplicity only the markers in the QTL confidence intervals, along with the terminal two markers at each end of the QTL-containing chromosomes, are shown. Full map data is provided in File S1.

