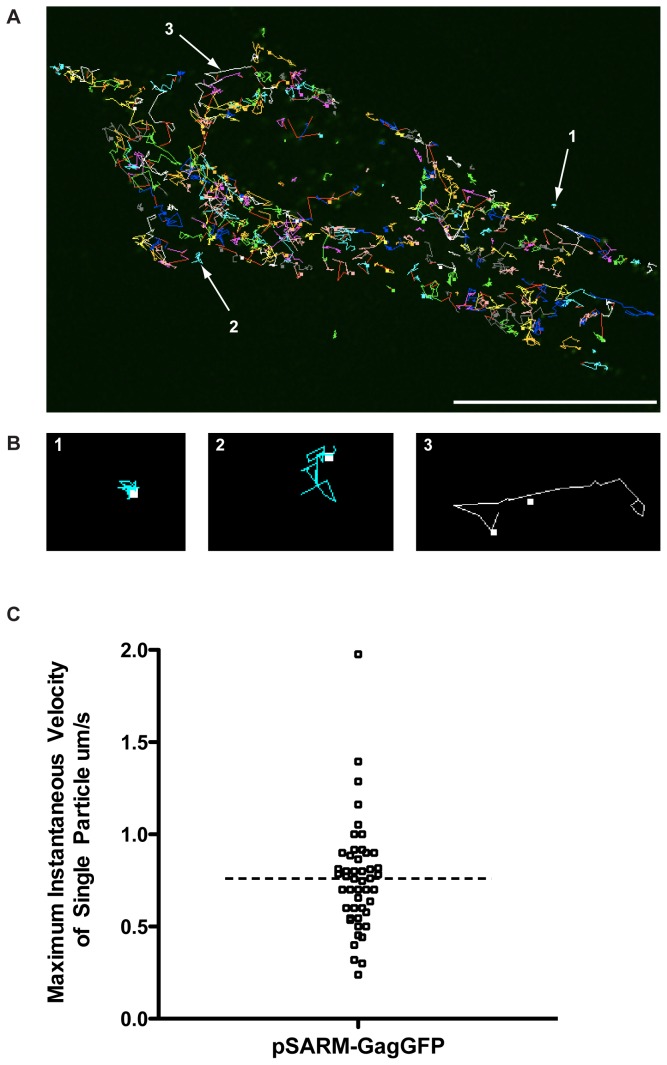
Figure 5. Real-time imaging of GagGFP fusion protein in live cells.
(A) M-PMV expressing CMMT cells were transfected with pSARM-GagGFP-M100A and visualized 24 hours later in real-time every 5 seconds for 2 minutes. Using the Particle Tracker plug-in on FIJI, particles were detected and then tracked. Scale bar = 20 µm. Real time imaging of these frames is shown in movie S1. (B) Trajectory data showed trajectories with restricted movement and little to no displacement from the beginning to the end of the trajectory path (1), trajectories where the particle moved in an erratic, Brownian manner, and displayed very little displacement (2) and long tracks with significant displacement from the beginning of the track to the end (3). (C) To calculate the instantaneous velocity for a trajectory in population 3, the distance traveled between each time point was calculated and divided by the time interval (5s). Maximum instantaneous velocity refers to the maximum instantaneous velocity for an individual trajectory.

