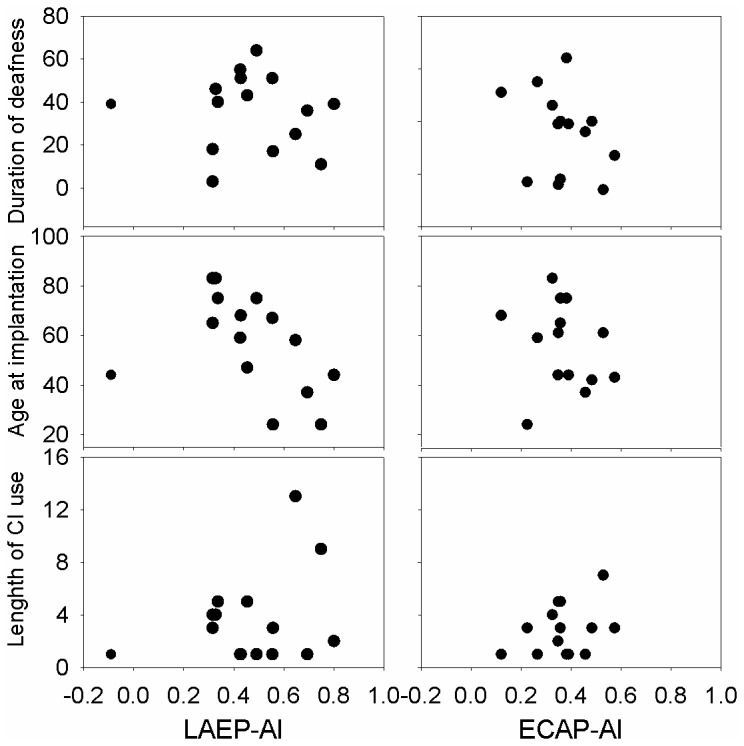
Figure 8. The correlation between adaptation index and demographic factors including the duration of deafness, the age at implantation, and the length of CI use.

Among all the scatter plots, the correlation between AILAEP and the age of implantation is statistically significant, if one outlier that shows amplitude enhancement rather than adaptation is not included in the analysis.
